


EUR/USD:
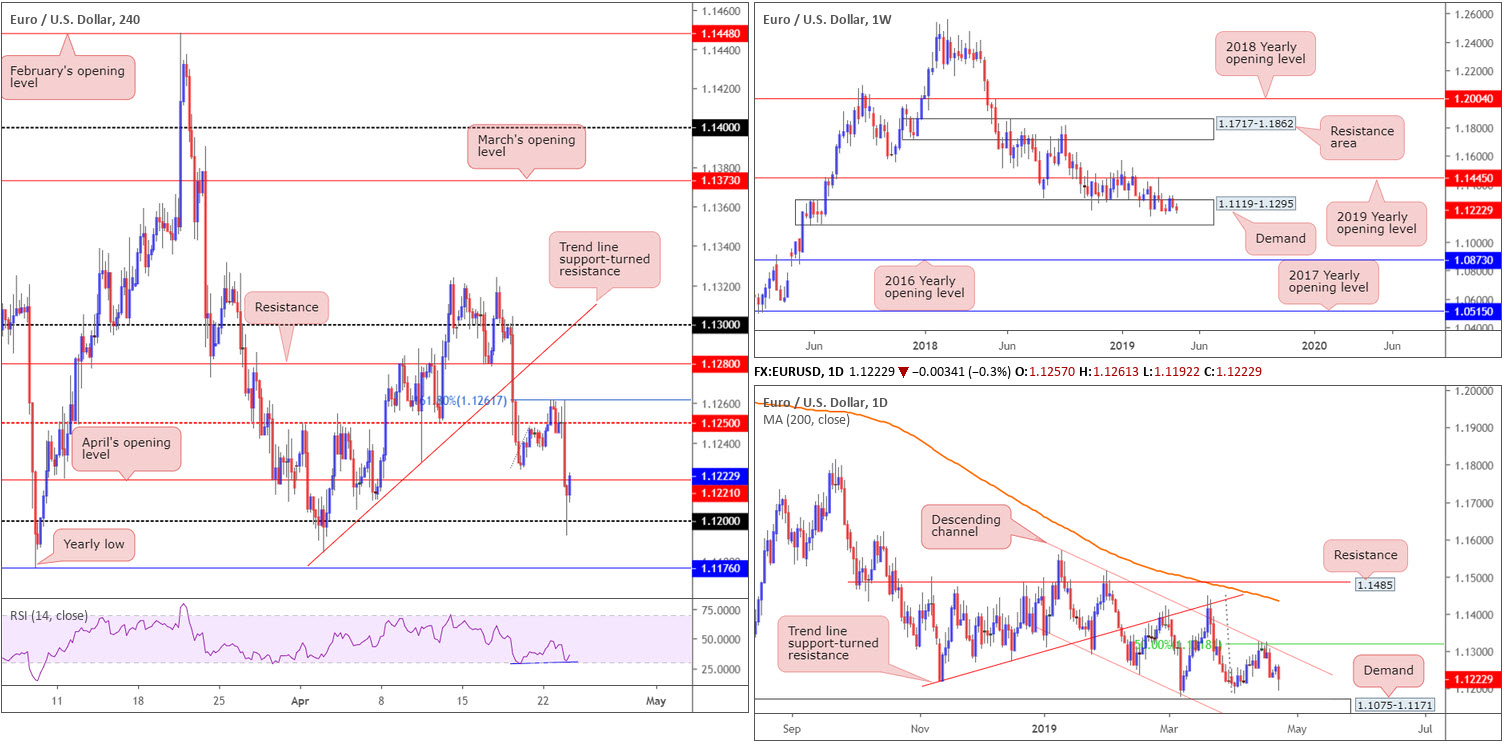
Capital flooded into US markets Tuesday as many traders returned from the long holiday weekend. The US dollar index, or ‘DXY’, refreshed 2019 highs at 97.78, though is likely to find fresh opposition nearby at 97.72, a long-standing weekly resistance.
Dollar strength increased ahead of the US open, weighing on the euro considerably. As evident from the H4 timeframe, the EUR/USD respected its 161.8% Fibonacci ext. point at 1.1261 and swarmed through 1.1250 support and April’s opening level at 1.1221, consequently unlocking the gates for a test of 1.12. Accompanied by mild RSI divergence (blue line), the pair rotated higher from 1.12 and, at the time of writing, is retesting the underside of 1.1221 as resistance.
On a broader perspective, buyers and sellers remain warring for position within the walls of a reasonably long-standing weekly demand area at 1.1119-1.1295. A break of the area to the downside has the 2016 yearly opening level at 1.0873 to target, whereas a recovery higher may call for a retest of the 2019 yearly opening level at 1.1445.
Counter to weekly demand, price action on the daily timeframe shook hands with channel resistance (extended from the high 1.1569) and a merging 50.0% resistance value at 1.1318 last week. Although the market could, theoretically, observe another retest of this channel resistance, the next downside points to have eyes on fall in around the 1.1183 Apr 2 low, shaded closely by demand at 1.1075-1.1171 (glued to the underside of the current weekly demand area).
Areas of consideration:
Well done to any of our readers who managed to short 1.1261 – absolutely awesome trade.
Short-term (H4), the research team notes limited confluence to work with at this time. Couple this with higher-timeframe movement also providing little in terms of meaningful direction, this might be a market best left on the back burner today.
Today’s data points: German ifo Business Climate.
GBP/USD:
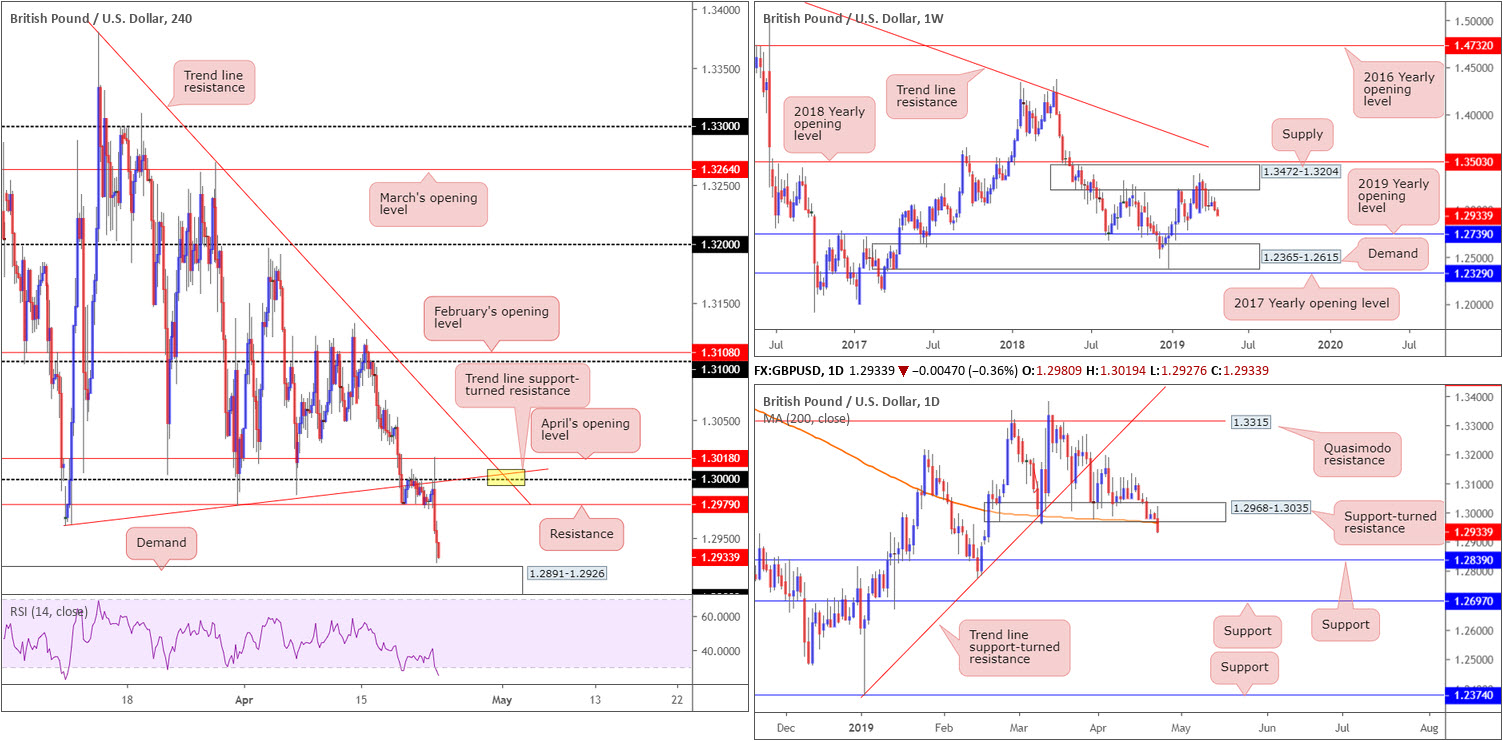
Sterling ceded ground against its US counterpart Tuesday, sinking to lows of 1.2927, levels not seen since mid-February. A combination of sympathy (euro) selling (note the strong correlation between the EUR/USD and GBP/USD), robust USD buying and pressure on UK PM May to leave her role, collectively weighed on the already feeble GBP.
From a technical perspective, further selling could be on the cards according to the weekly timeframe. Higher-timeframe flows has weekly movement threatening lower prices, after spending nearly two months consolidating around the underside of supply at 1.3472-1.3204, situated a few points south of the 2018 yearly opening level at 1.3503. With the next obvious downside target not realised on this timeframe until the 2019 yearly opening level at 1.2739, followed by demand coming in at 1.2365-1.2615, sellers still have plenty of room to manoeuvre if they press lower.
In conjunction with weekly flow, daily price recently crossed beneath its 200-day SMA (orange) and also overthrew a block of support coming in at 1.2968-1.3035 (now acting resistance). This has potentially set the stage for a run towards support at 1.2839.
While both weekly and daily activity signal downside, the H4 candles face fresh demand pencilled in at 1.2891-1.2926, and an oversold RSI. Note the said demand also houses the 1.29 handle within its borders.
Areas of consideration:
Things are not looking too promising for the buyers at this point. A long from the current H4 demand, given the surrounding picture, is precarious and probably best avoided, according to our technical studies.
As for selling, 1.2979 on the H4 timeframe looks reasonable. The research team also favours the 1.30 barrier for shorts, particularly at the point two H4 trend line resistances merge (yellow). Whether these levels are tested before price continues lower, though, is difficult to judge.
Today’s data points: UK Public Sector Net Borrowing.
AUD/USD:
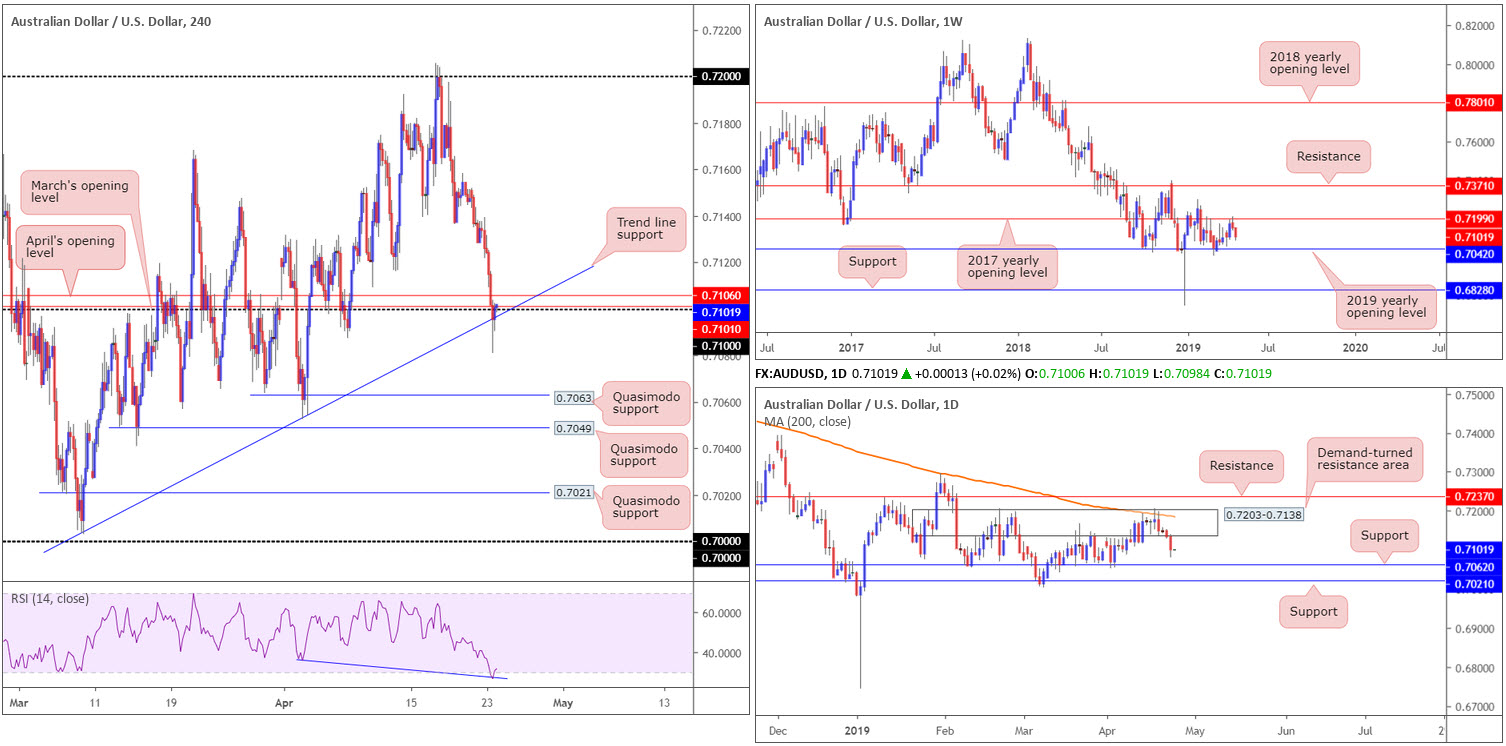
Recording its fourth consecutive daily loss Tuesday, largely a function of dollar moves, H4 movement shook hands with a notable trend line support (etched from the low 0.7003), and was accompanied by RSI divergence/oversold (blue line). Although trend lines of this calibre tend to hold price, it has its work cut out for it here. Overhead on the H4 timeframe, immediate resistance is in play around 0.71, as well as April and March’s opening levels at 0.7106/0.7101.
In addition to H4 resistances, both weekly and daily flow points to a lower market, with the closest support coming in on daily structure at 0.7062, followed by another layer of support priced in at 0.7021. Should buyers fail to hold the aforesaid trend line support, the next area of interest on the H4 timeframe falls in around Quasimodo support at 0.7063 (essentially representing daily support highlighted above at 0.7062), closely shadowed by another film of Quasimodo support at 0.7049.
Areas of consideration:
In light of the number of competing themes facing the current H4 trend line support, despite RSI confirmation, entering long from this base is a chancy move, according to our technical reading. With that being the case, focus shifts to a potential break lower and run towards Quasimodo support at 0.7063/daily support at 0.7062.
An ideal scenario would be for a H4 bearish close to form beneath the trend line support that’s followed up with a retest in the shape of a bearish candlestick signal (entry and risk parameters can be determined according to this pattern).
Today’s data points: Australian Inflation (CPI q/q).
USD/JPY:
Outlook unchanged due to lacklustre movement.
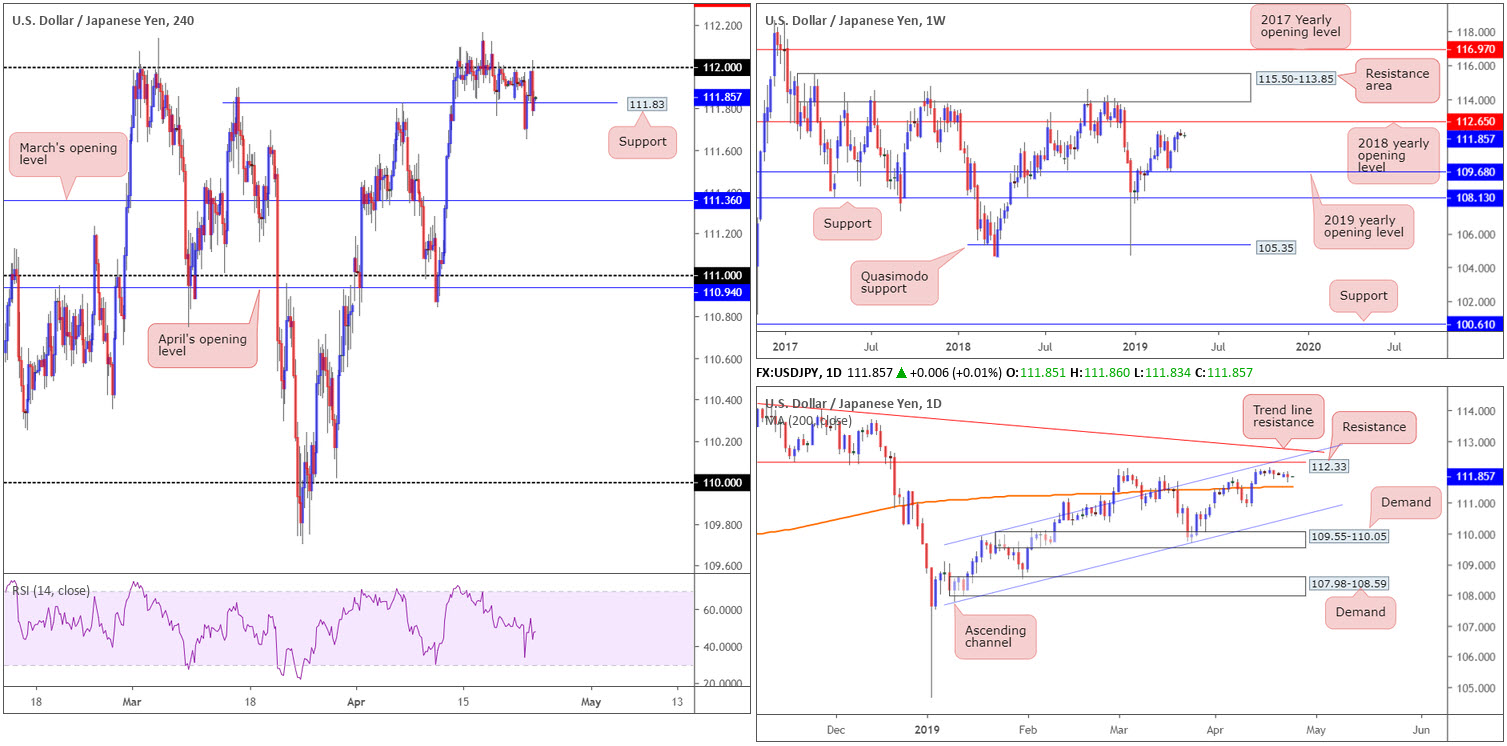
Following a failed attempt to break H4 support at 111.83, the pair retested 112 and held ground. Although price volatility increased as traders returned from the long Easter weekend, the research team’s outlook remains unchanged. In light of this, much of the following report will echo similar thoughts put forward in yesterday’s briefing.
According to H4 flow, above 112, traders’ crosshairs are likely fixed on daily resistance coming in at 112.33 (not visible on the H4 timeframe), whereas beneath 111.83, there’s little stopping the unit from reaching March’s opening level at 111.36.
Price action on the weekly timeframe has the candles facing the March 4 high at 112.13, shadowed closely by the 2018 yearly opening level priced in at 112.65. Crossing over to daily structure, the research team notes the 112.33 resistance level, which happens to fuse with a channel resistance (drawn from the high 109.88), and a nearby trend line resistance (etched from the high 114.54). To the downside, the 200-day SMA (orange) is in sight.
Areas of consideration:
Daily resistance at 112.33 appears a prime location for shorts in this market, with stop-loss orders plotted beyond the daily trend line resistance highlighted above. The only caveat to this, aside from a reasonably strong trending market at the moment (clearly visible on the daily timeframe above the 200-day SMA), is weekly price threatening to press as far north as 112.65. For that reason, before pulling the trigger on a sell from 112.33, traders are recommended to wait for additional confirmation. This could be anything from a moving average crossover, a H4 bearish candlestick signal or even drilling down to the lower timeframes and trading local structure.
An alternative to 112.33 is a H4 close back beneath support at 111.83 that’s followed up with a retest by way of a H4 bearish candlestick signal (entry/risk levels can be determined according to the candlestick pattern). The first take-profit zone can be seen around the 200-day SMA floating around the 111.53 neighbourhood, closely shadowed by March’s opening level on the H4 timeframe at 111.36.
Today’s data points: Limited.
USD/CAD:
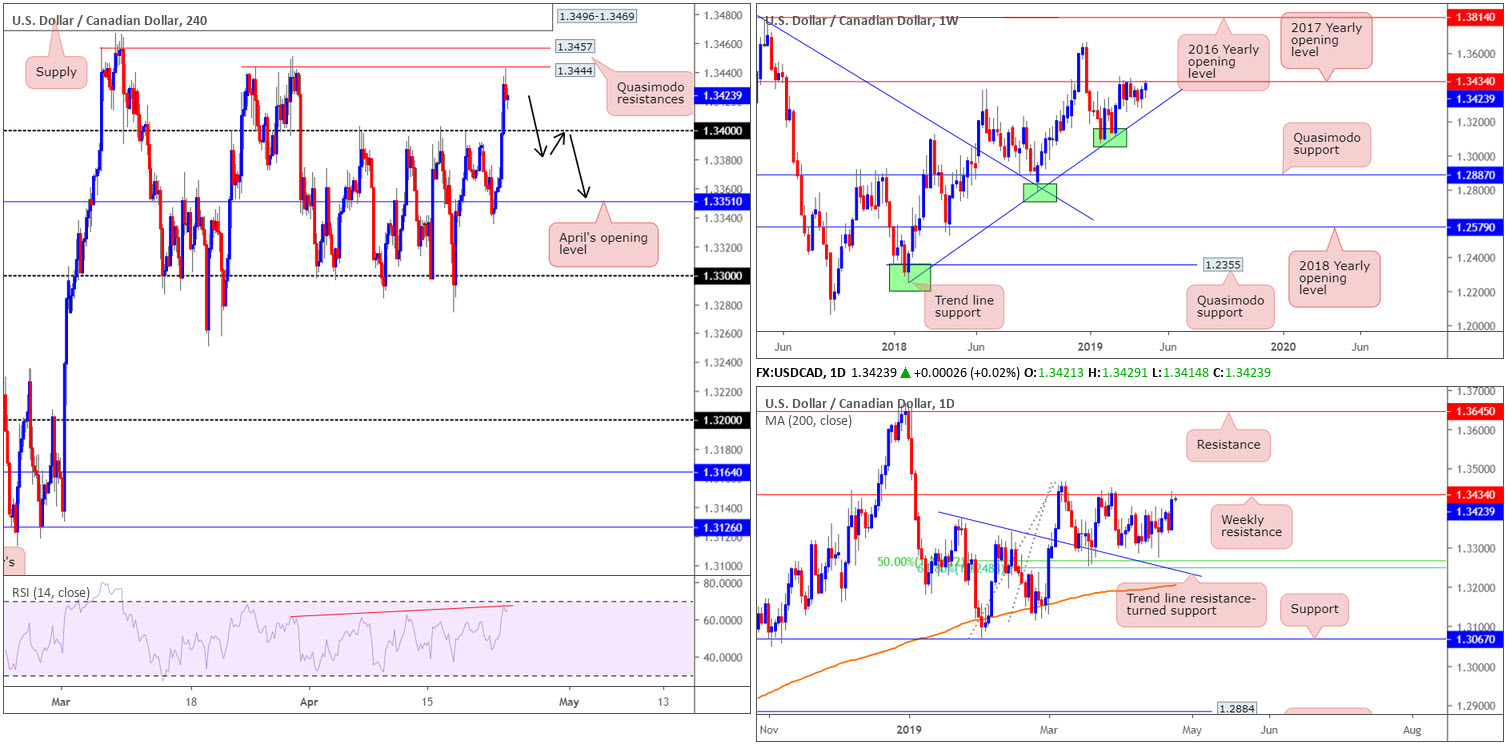
Despite WTI continuing to advance Tuesday as market participants digest the expiry of US waivers on Iranian crude, the USD/CAD rallied in lockstep with the US dollar index, which refreshed 2019 highs at 97.78.
The H4 candles, as you can see, engulfed 1.34 to the upside in strong fashion and came within a few points of connecting with Quasimodo resistance at 1.3444. One of the reasons for price stopping short of this barrier could be due to higher-timeframe flow shaking hands with weekly resistance at 1.3434: a 2017 yearly opening level. It might also interest some traders to note the RSI indicator currently displays a divergence reading (red line).
Arguably, weekly pressure could force a retest of 1.34 as support today and possibly even break back beneath the psychological mark.
Areas of consideration:
To verify seller interest exists in this market following yesterday’s bullish assault, the research team notes to watch for a H4 close back beneath 1.34. This not only proves seller intent, it also provides traders a resistance level to sell should the number draw in a retest (black arrows), targeting April’s opening level on the H4 at 1.3351 as the initial take-profit zone.
Today’s data points: BoC Monetary Policy Report; BoC Rate Statement and Overnight Rate.
USD/CHF:
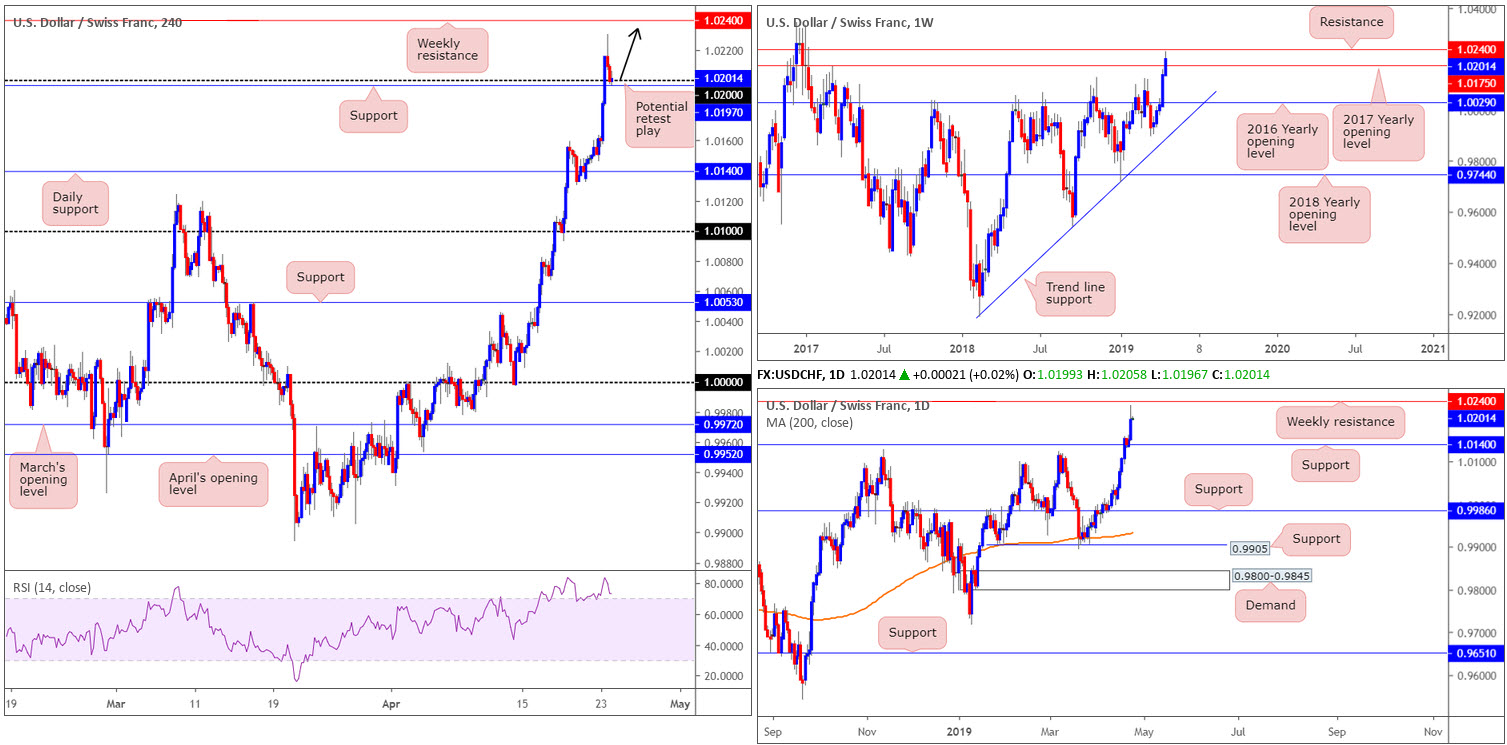
The US dollar continued to scale higher vs. the Swiss franc Tuesday, up 0.61% so far this week. The USD/CHF caught some aggressive bids on the back of broad-based USD bidding, lifting the H4 candles beyond its 1.02 handle to highs of 1.0230.
As you can see, though, the unit settled for the day retesting 1.02 as well as nearby support coming in at 1.0197, which for now, is holding ground. With the path north clear for a run towards weekly resistance plotted at 1.0240, buying from 1.02 could be an option.
Areas of consideration:
Keeping it ‘short and sweet’ this morning, a long from 1.02 is likely of interest today. On account of psychological numbers being prone to fakeouts (also known as stop runs), traders are urged to wait and see if H4 price chalks up a bullish candlestick signal, either on the H1 or H4 – think Hammer/Pin-bar formation or Engulfing pattern. This not only identifies buyer intent, it also offers clear entry/risk parameters to work with.
Today’s data points: Limited.
Dow Jones Industrial Average:
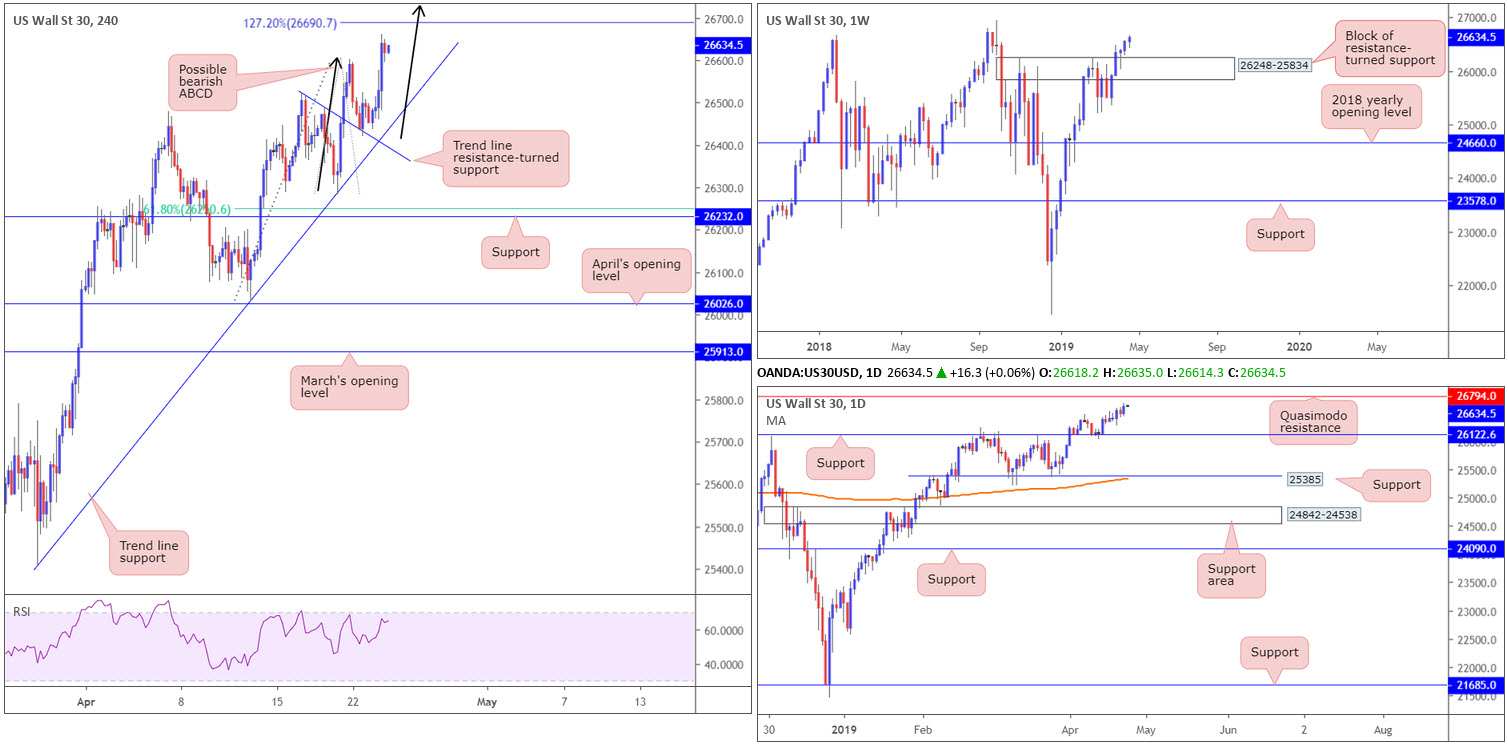
Close of trade Tuesday saw the Dow Jones Industrial Average add 0.48% to hit a fresh 2019 high of 26662, while the S&P 500 climbed 0.88% and the tech-heavy Nasdaq Composite added 1.26%.
Investors are cheering ‘a really great string of earnings reports, most of them outpacing expectations, as well as some pretty good commentary on future estimates from CEOs,’ said Jim Paulsen, chief investment strategist at Leuthold Weeden (cited from Bloomberg).
From a technical standpoint, weekly structure is seen advancing above 26248-25834 (a block of resistance-turned support), and has the 2018 high at 26939 in sight. Meanwhile, daily flow is poised to test a nearby Quasimodo resistance at 26974. Note the index remains firmly positioned above its 200-day SMA (orange).
A closer reading of the H4 timeframe has the candles eyeing a possible 127.2% ABCD (black arrows) bearish formation at 26690, after making headway off a local trend line resistance-turned support (taken from the high 26525).
Areas of consideration:
With the underlying trend emphasising strength, and both weekly and daily charts portending a move beyond the 127.2% Fibonacci ext. 26690, attempting a short from here is uncertain territory.
In the event we test nearby H4 trend line support (taken from the low 25410), a long could be something to consider, preferably before reaching 26690. Conservative traders may opt to wait and see if H4 price chalks up a bullish candlestick signal before pulling the trigger (entry/risk levels can be based off this pattern), due to a potential fakeout beneath the line.
Today’s data points: Limited.
XAU/USD (GOLD):
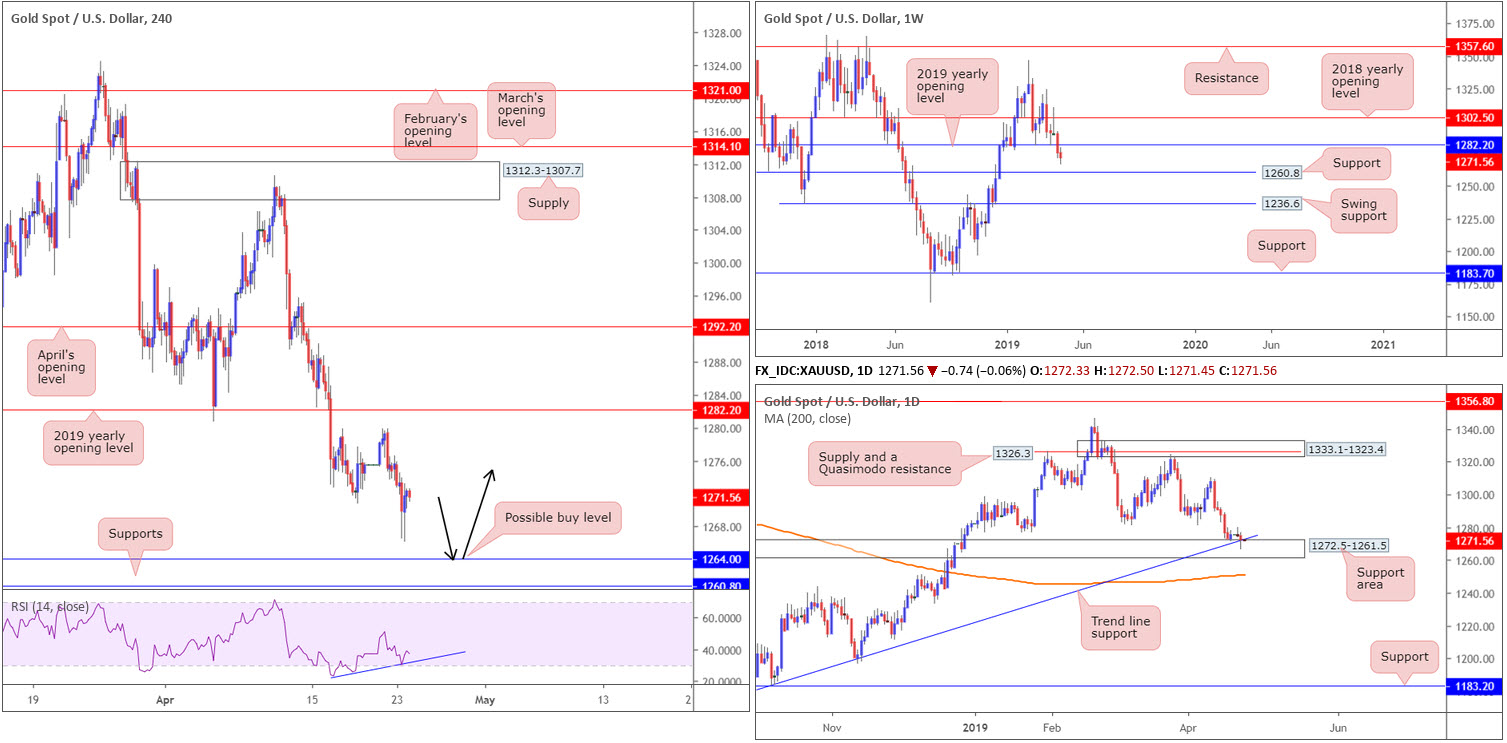
Across the board, the US dollar explored higher ground Tuesday, reaching fresh 2019 highs of 97.78. In response to this, spot gold declined in value, consequently testing fresh 2019 lows of 1266.4.
Recent selling on the H4 timeframe has drawn the candles to within striking distance of support at 1264.0, closely shadowed by a Quasimodo resistance-turned support at 1260.8. Traders may also want to acknowledge the RSI indicator is currently displaying a divergence reading (blue line).
1264.0 is also housed within a daily support area coming in at 1272.5-1261.5, which happens to align with a trend line support (taken from the low 1160.3). Interestingly, though, higher-timeframe flows also have weekly candles trading sub 1282.2: the 2019 yearly opening level, potentially setting the stage for a run towards support plotted at 1260.8 (representing the H4 support highlighted above).
Areas of consideration:
On account of the above reading, the H4 support at 1264.0, owing to its connection with daily structure, is an attractive platform for longs today. It is, however, recommended to wait for additional confirmation to take shape before pulling the trigger (entry and risk levels can be determined according to the confirmation technique applied). This is due to weekly price threatening lower prices. As for upside targets out of 1264.0, it’s a little difficult to judge without seeing the approach, though for now, the research team has eyes on 1270.7 as an initial port of call.
The accuracy, completeness and timeliness of the information contained on this site cannot be guaranteed. IC Markets does not warranty, guarantee or make any representations, or assume any liability with regard to financial results based on the use of the information in the site.
News, views, opinions, recommendations and other information obtained from sources outside of www.icmarkets.com.au, used in this site are believed to be reliable, but we cannot guarantee their accuracy or completeness. All such information is subject to change at any time without notice. IC Markets assumes no responsibility for the content of any linked site. The fact that such links may exist does not indicate approval or endorsement of any material contained on any linked site.
IC Markets is not liable for any harm caused by the transmission, through accessing the services or information on this site, of a computer virus, or other computer code or programming device that might be used to access, delete, damage, disable, disrupt or otherwise impede in any manner, the operation of the site or of any user’s software, hardware, data or property.