


EUR/USD:
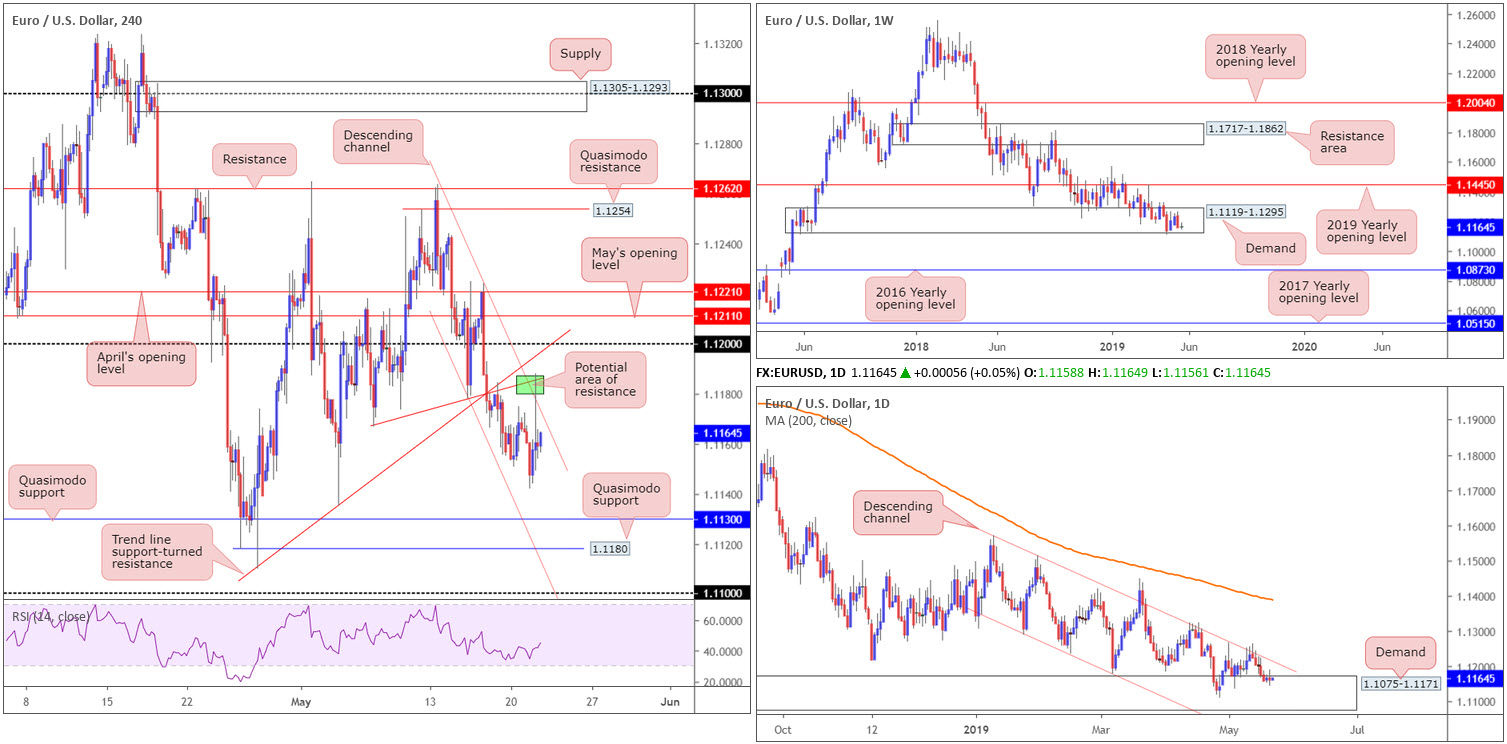
For folks who read Tuesday’s briefing you may recall the piece highlighted a merging channel resistance (taken from the high 1.1263) and local trend line support-turned resistance (1.1166) on the H4 timeframe as a potential area for selling opportunities (green). Although the barrier held ground, the move was swift, with the single currency popping as far north as 1.1188 in the space of five minutes, taking cues from sterling in a kneejerk reaction to UK PM May’s speech. The next downside target from this point, aside from yesterday’s low 1.1142, can be found at a Quasimodo support drawn from 1.1130.
On more of a broader perspective, buyers and sellers remain trading within the lower limits of a long-standing demand zone at 1.1119-1.1295 on the weekly timeframe. In the event a break of the aforesaid demand is observed, traders’ crosshairs will likely be fixed on the 2016 yearly opening level at 1.0873. This, according to our technical studies, is a strong possibility, given the long-term trend facing a southerly bearing since topping in early 2018.
The central focus on the daily timeframe is demand parked at 1.1075-1.1171, thanks to a rejection off long-term channel resistance taken from the high 1.1569 early last week. Although the demand is glued to the underside of the current weekly demand area, traders are encouraged to pencil in the next downside target on the daily scale in the event we push lower: a particularly interesting area of demand coming in at 1.0860-1.0954 (not visible on the screen), which happens to envelope the 2016 yearly opening level mentioned above on the weekly timeframe at 1.0873.
Areas of consideration:
Longer term, although the overall trend is facing south, this market offers a difficult short owing to demand seen on the weekly and daily timeframes.
Shorter-term traders, though, may already be short this market from 1.1184ish: the combination of a H4 channel resistance (taken from the high 1.1263) and the local trend line support-turned resistance (1.1166). Reducing risk to breakeven at this point is an option, with the first take-profit target set around 1.1130.
Traders who missed the initial call to sell may be given a second opportunity to participate should the market witness a retest of the current H4 channel resistance and pencil in a H4 bearish candlestick signal (entry and risk can be structured according to the candlestick’s rules of engagement), or any arrangement of confirmation signal your methodology deems suitable.
Today’s data points: FOMC Member Bullard and Williams Speak; FOMC Meeting Minutes.
GBP/USD:
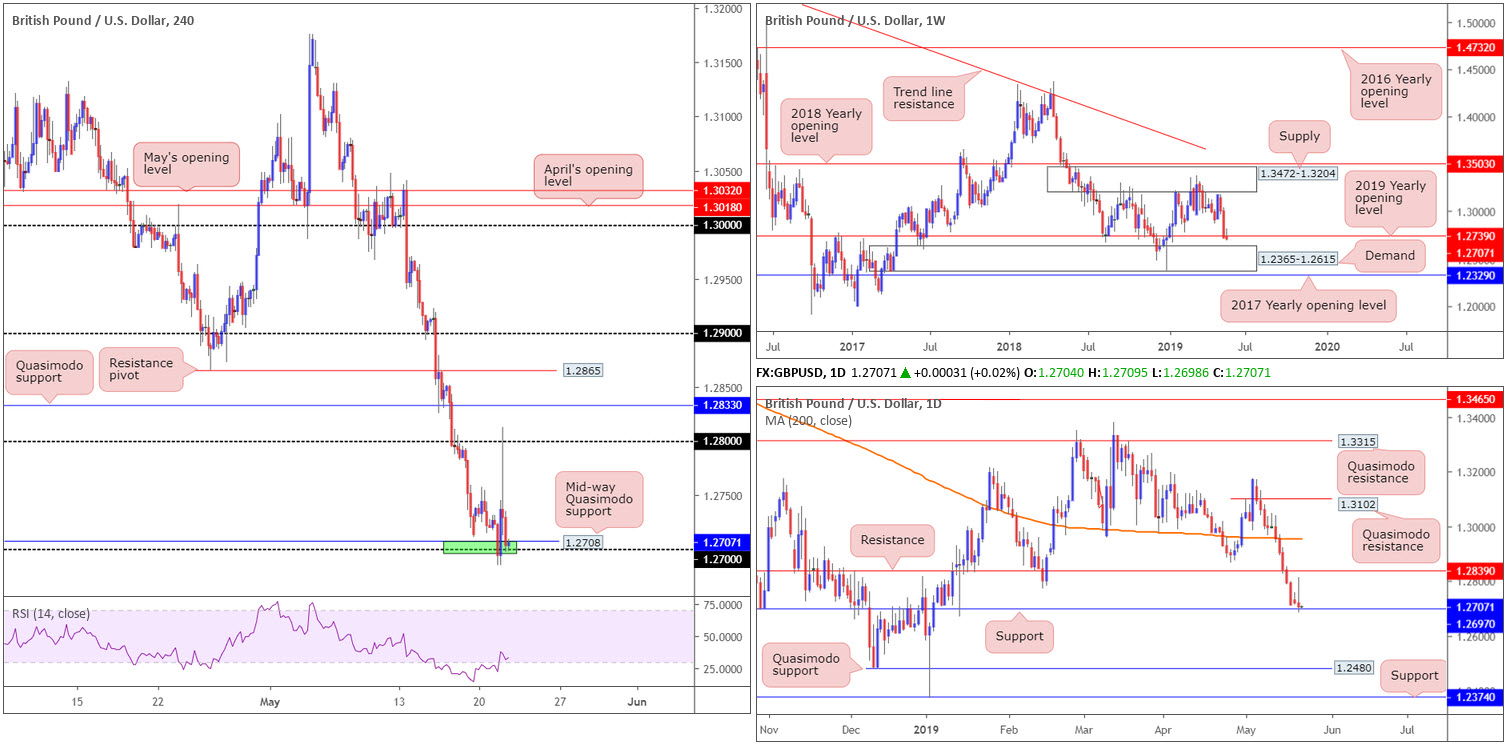
In recent sessions, the market witnessed sterling spike higher on speculation UK PM May was to offer major concessions on Brexit in an effort to push a deal through Parliament. Though the move reached as far north as 1.2812, price action swiftly overturned its position after it became clear her deal hadn’t secured the desired backing for successful passage.
For those who read Tuesday’s report you may recall the piece highlighted 1.2697/1.2708 as a potential base of support to work with on the H4 timeframe (green). Comprised of a mid-way Quasimodo support level at 1.2708, the 1.27 handle and a daily support level at 1.2697, the zone held for at least 100+ points.
With bids likely weakened around the 1.27 neighbourhood, and weekly activity displaying signs of softness beneath the 2019 yearly opening level at 1.2739, the odds of the market exploring lower ground is high. The next area of interest on the H4 timeframe below 1.27 falls in at a support area drawn from 1.2606-1.2646 (not seen on the screen), which happens to circulate around the top edge of weekly demand at 1.2365-1.2615 (the next downside target beyond 1.2739). In terms of the daily timeframe, Quasimodo support at 1.2480 appears to be the next logical floor on this scale.
Areas of consideration:
Should our technical reading prove accurate and the H4 candles pencil in a close beneath 1.27, a sell in this market is a possibility, targeting the top edge of the H4 support area mentioned above at 1.2606-1.2646 as an initial point. Aggressive traders might look to simply sell the breakout candle through 1.27 and calculate risk levels based on the upper shadow of the breakout candle, whereas conservative traders may opt to wait for a retest of 1.27 to develop before pulling the trigger. The latter is considered the more conservative route, using the rejection candle as a structure to base entry and risk levels from.
Today’s data points: UK CPI y/y; UK Inflation Report Hearings; UK PPI Input m/m; UK Public Sector Net Borrowing; FOMC Member Bullard and Williams Speak; FOMC Meeting Minutes.
AUD/USD:
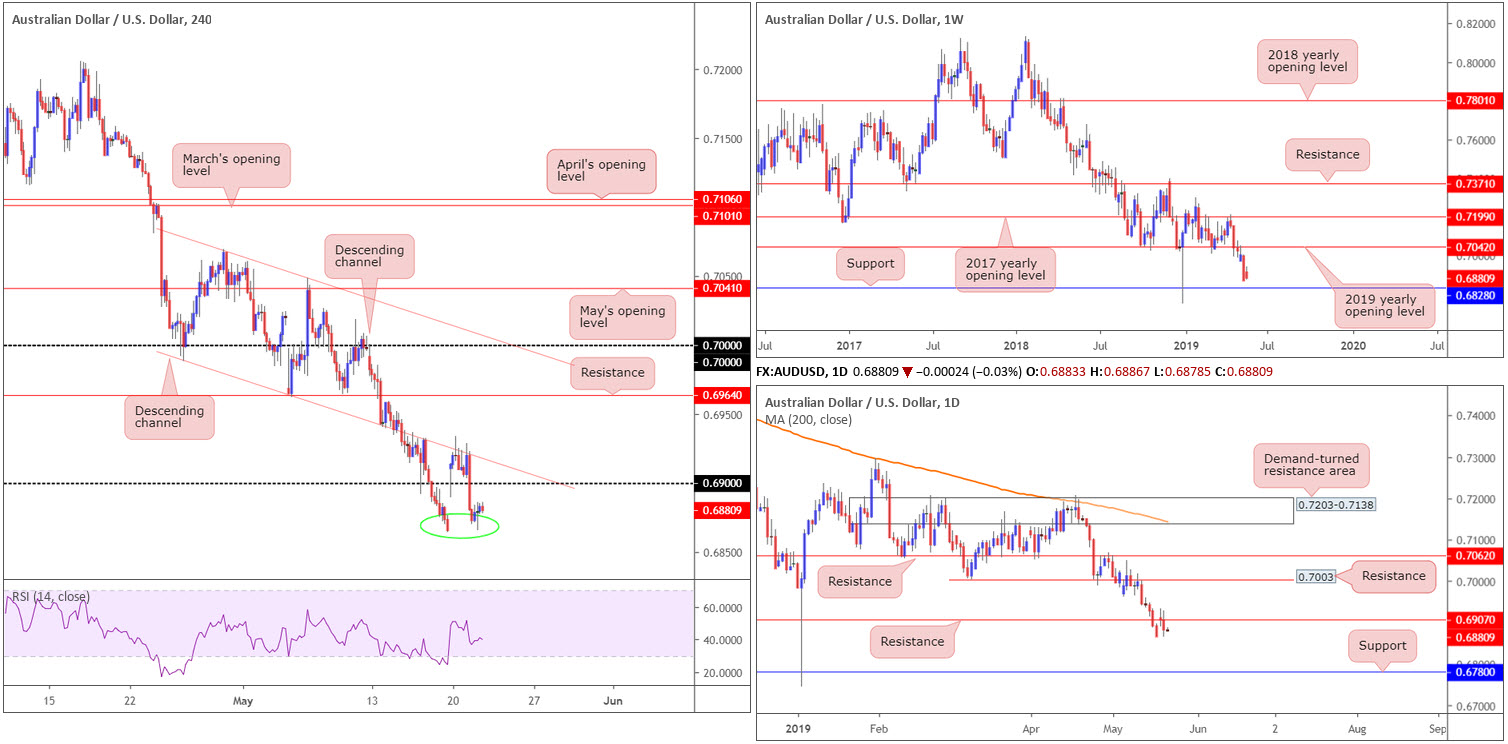
Unable to overthrow H4 channel support-turned resistance (extended from the low 0.6988), the Australian dollar ceded ground against its US counterpart in the early hours of Tuesday’s session, weighed on by RBA meeting minutes emphasising there was not a strong case for a near-term move in the cash rate. Further weighing on the commodity currency was the dovish tone from Governor Lowe, stating ‘at our meeting in two weeks, we will consider the case for lower interest rates’.
The move lower reclaimed 0.69 to the downside, filling the weekend gap and clocking a session low of 0.6866. Sub 0.69, the research team notes limited support, aside from the local base (green circle) around 0.6866ish, until connecting with 0.68. This downside projection is further highlighted on the higher timeframes. Weekly price exhibits scope to press as far south as support coming in at 0.6828, and daily action, after crossing back beneath support (now acting resistance) at 0.6907, has support at 0.6780 to target.
Areas of consideration:
On account of the overall technical picture, the pendulum appears to be swinging in favour of sellers at the moment. Should the market observe a retest to the underside of 0.69 that holds ground, preferably in the shape of a H4 bearish candlestick formation, a sell is certainly worthy of consideration, steering towards 0.6860 as an initial take-profit zone, followed by 0.6828: the weekly support level.
Today’s data points: Australia Construction Work Done q/q; FOMC Member Bullard and Williams Speak; FOMC Meeting Minutes.
USD/JPY:
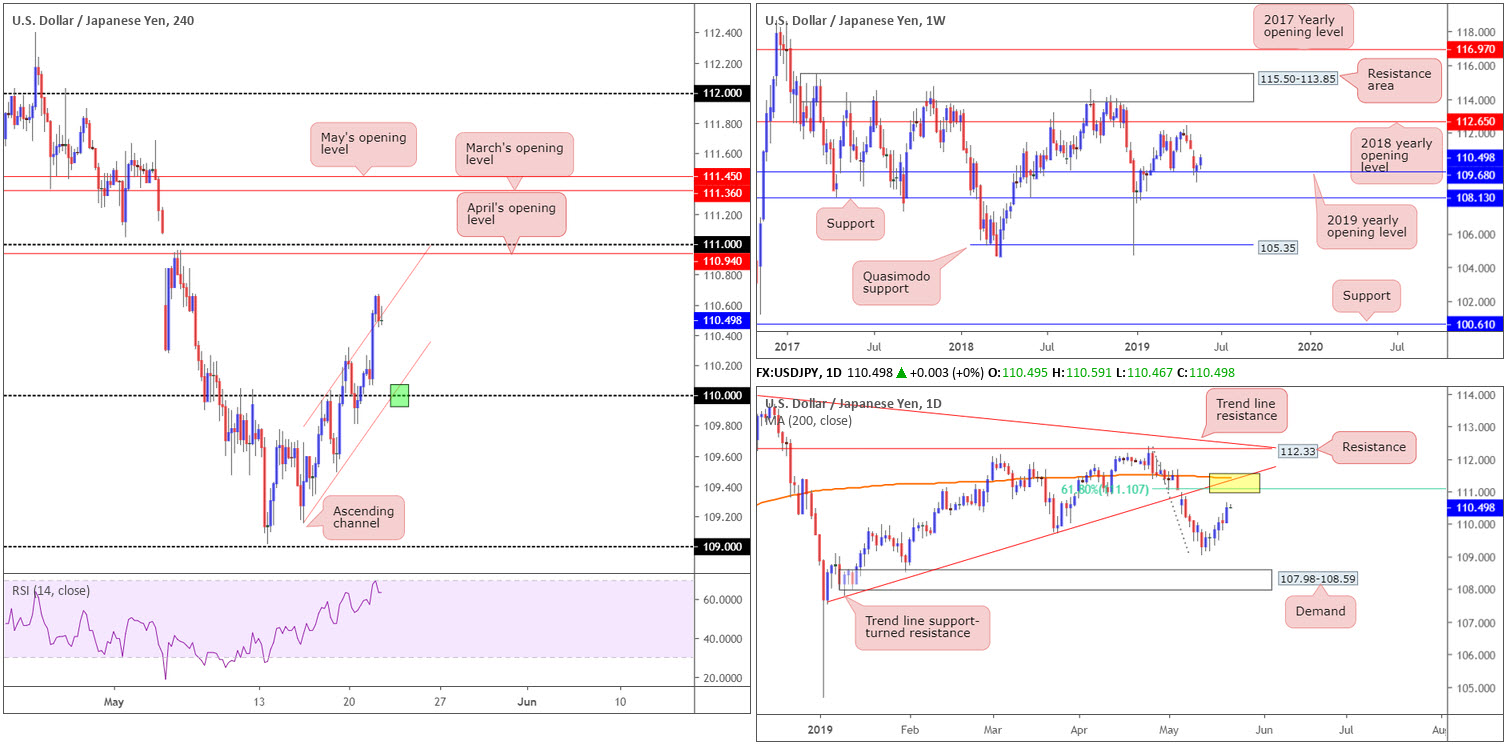
Despite the US dollar index failing to secure a comfortable position above 98.00, the USD/JPY, likely aided by an improvement in risk sentiment and higher US yields, explored higher ground Tuesday, concluding the session +0.40% in the green.
Technically speaking from the weekly timeframe, the advance should not really come as much of a surprise as the candles found support off its 2019 yearly opening level at 109.68 in the mould of a reasonably attractive hammer pattern last week. Continued bidding could ultimately witness the pair knock on the door of its 2018 yearly opening level at 112.65.
Further buying is also a possibility on the daily timeframe, according to our technical studies, as the unit appears poised to approach a 61.8% Fibonacci resistance at 111.10. What gives this Fib level extra credibility is a merging trend line support-turned resistance etched from the low 107.77 and the 200-day SMA (yellow).
A closer reading of movement on the H4 timeframe sees the candles continue to compress within an ascending channel formation (109.15/109.96). As of late, the top limit of this pattern is being tested and is holding, despite a run to a high of 110.67. It is also worth pointing out recent buying has driven the RSI indicator towards its overbought line.
Areas of consideration:
In order to become buyers within this market, one option, as highlighted in Tuesday’s report, is to wait and see if the H4 candles retest the point at where the current H4 channel support intersects with the 110 handle (green), with an ultimate upside target of 111.10ish.
Traders might also want to consider waiting and seeing if the H4 candles formulate a bullish candlestick signal off the psychological boundary. This helps confirm buyer intent and also gives credence to higher-timeframe direction. Upon a successful rejection off 110, a long on the close of the selected candle is an idea, with a protective stop-loss order plotted beneath its lower shadow.
Today’s data points: FOMC Member Bullard and Williams Speak; FOMC Meeting Minutes.
USD/CAD:
Outlook unchanged.
Over the course of Tuesday’s session, traders witnessed the USD/CAD press lower and extend Monday’s losses.
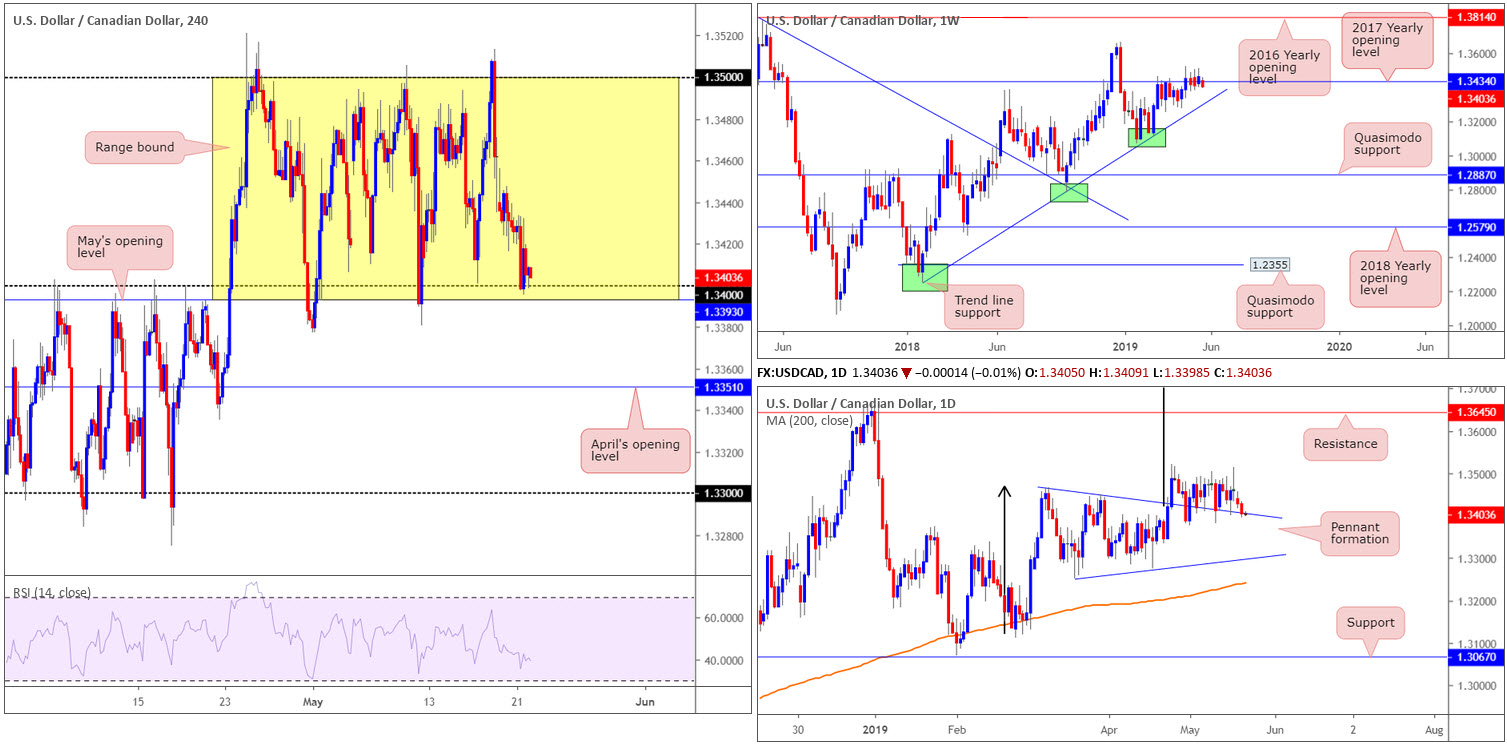
The H4 candles, since the latter part of April, have been busy carving out a 100-point+ range between May’s opening level at 1.3393 and the round number 1.35. Note price action shook hands with the lower boundary of this range in recent movement and is so far holding firm.
On a wider context, longer-term flows broke out above the 2017 yearly opening level at 1.3434 on the weekly timeframe, though has so far failed to breed much follow-through momentum. Areas outside of this level to be aware of fall in around the 2018 yearly high of 1.3664, and a trend line support etched from the low 1.2247.
A closer reading of price action shows the daily candles continue to feed off support drawn from the top edge of a pennant pattern (1.3467). Although the traditional price target (calculated by taking the distance from the beginning of the preceding move and adding it to the breakout price) remains on the chart at 1.3768 (black arrows), the next upside target from a structural standpoint falls in around resistance at 1.3645.
Areas of consideration:
1.34/May’s opening level at 1.3393 is an area of interest on the H4 timeframe for possible longs. Not only does the base represent the lower edge of the current H4 range, it is also further reinforced by the top edge of the daily pennant formation highlighted above. For conservative traders, waiting for a H4 bullish candlestick to print from this region will help identify buyer intent and also serve as a structure to base entry and risk levels from.
Today’s data points: FOMC Member Bullard and Williams Speak; FOMC Meeting Minutes; Canadian Core Retail Sales m/m.
USD/CHF:
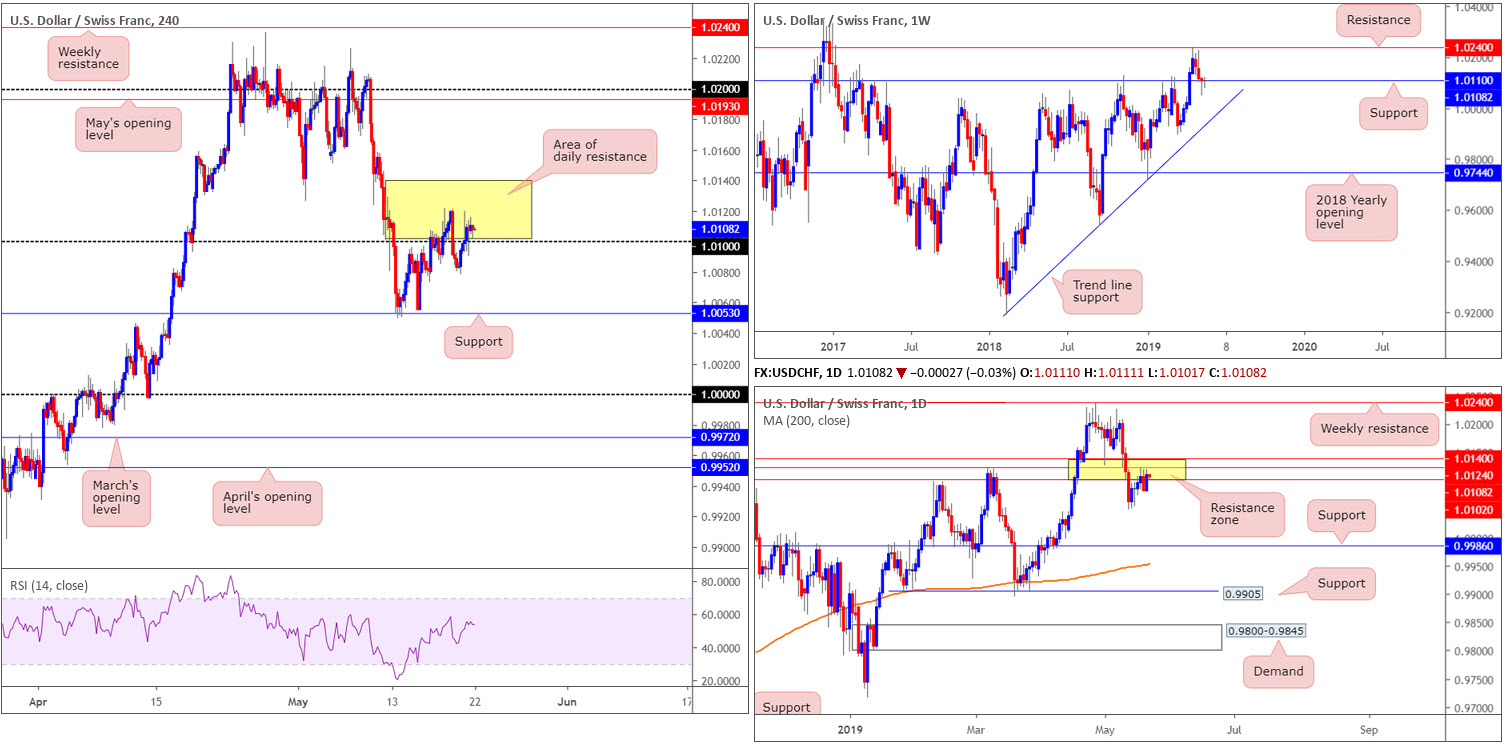
Reclaiming Monday’s losses and pushing back through 1.01 on the H4 timeframe, the US dollar advanced higher against its Swiss counterpart Tuesday, up 0.27%. Although a H4 close above 1.01 is considered a bullish indicator, traders face strong resistance out of the daily timeframe between 1.0140/1.0102 (yellow).
Reinforcing a possible run higher, nevertheless, is weekly price attempting to gain a grip above support at 1.0110. In the event additional buying is seen from here, resistance at 1.0240 can be seen as the next upside target on the weekly timeframe.
Areas of consideration:
With the H4 candles yet to produce much in the way of bullish intent above 1.01 (check out the real bodies of the candles) and daily price testing an area of resistance, traders considering a long position are encouraged to exercise caution.
The research team believes the buyers have yet to prove themselves on the H4 timeframe. A retest of 1.01 in the form of a strong bullish rotation candle (a full or near-full-bodied candle), however, would certainly place buying above 1.01 in a more favourable light. But until that time, patience is key.
Today’s data points: FOMC Member Bullard and Williams Speak; FOMC Meeting Minutes.
Dow Jones Industrial Average:
Outlook unchanged.
US stocks rebounded higher across the board Tuesday, after a temporary reprieve on restrictions on US exports to China telecom giant Huawei Technologies. The Dow Jones Industrial Average added 0.77%; the S&P 500 0.85% and the tech-heavy Nasdaq settled at +1.01%.
On the technical front, overall structure of the DJIA remains unchanged.
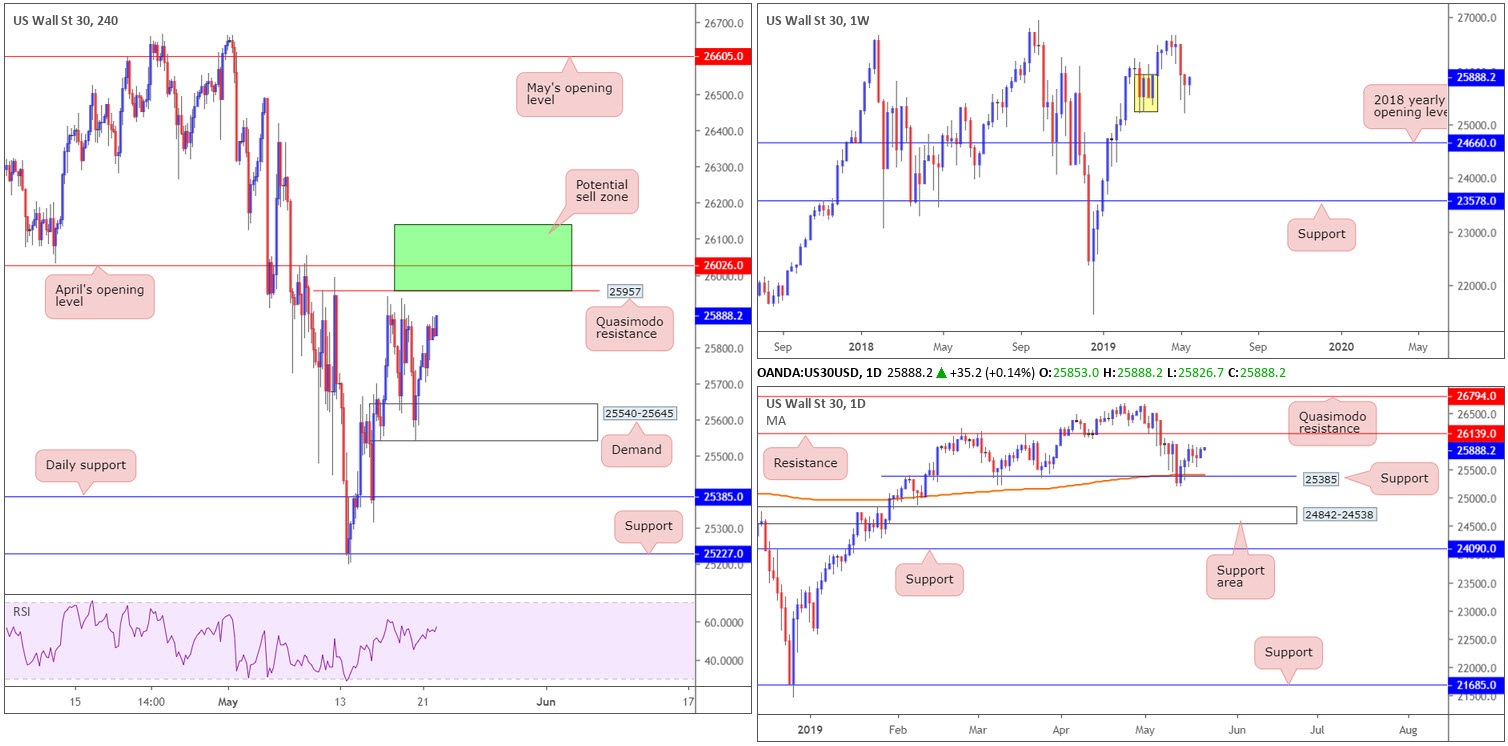
Weekly flow shows demand marked in yellow at 25217-25927, although unlikely to be considered a strong area on this timeframe owing to limited momentum produced from the base, remains in the fold. Traders may also want to acknowledge weekly price finished the week in the form of a hammer candlestick pattern. In the event this entices buyers into the market, we could be looking at a run towards the 26668 April 22 high.
Last week observed the index shake hands with notable support at 25385 on the daily timeframe, which happened to intersect with the 200-day SMA. Technically, this provided a platform for buyers to enter the market, with the next upside point of interest falling in at resistance fixed from 26139.
H4 flow has the candles rebounding from demand at 25540-25645, poised to possibly run towards a Quasimodo resistance at 25957, trailed closely by April’s opening level at 26026. Beyond the current demand, the research team also has daily support mentioned above at 25385 sited on the chart.
Areas of consideration:
While there is scope for a push higher on the weekly timeframe, daily price has resistance plotted within touching distance at 26139. On top of this, we also have short-term resistance on the H4 timeframe between 26026 and 25957. This resistance makes the current weekly hammer formation a problematic long, according to our technical studies.
On account of the above, the green area plotted on the H4 timeframe between 26139 (the daily resistance level) and 25957 (the collection of H4 resistances) is a zone worthy of attention for shorts. An ideal scenario would be for the H4 candles to chalk up a notable bearish candlestick configuration. Entry can be applied according to the candlestick’s rules, though stop-loss placement may be either above the daily resistance at 26139 (conservative) or above the upper shadow of the candlestick signal (aggressive).
Today’s data points: FOMC Member Bullard and Williams Speak; FOMC Meeting Minutes.
XAU/USD (GOLD):
Bullion surrendered additional ground to its US peer Tuesday, concluding the segment down by 0.25%. Depending on which timeframe is analysed, the technical view may echo a different vibe.
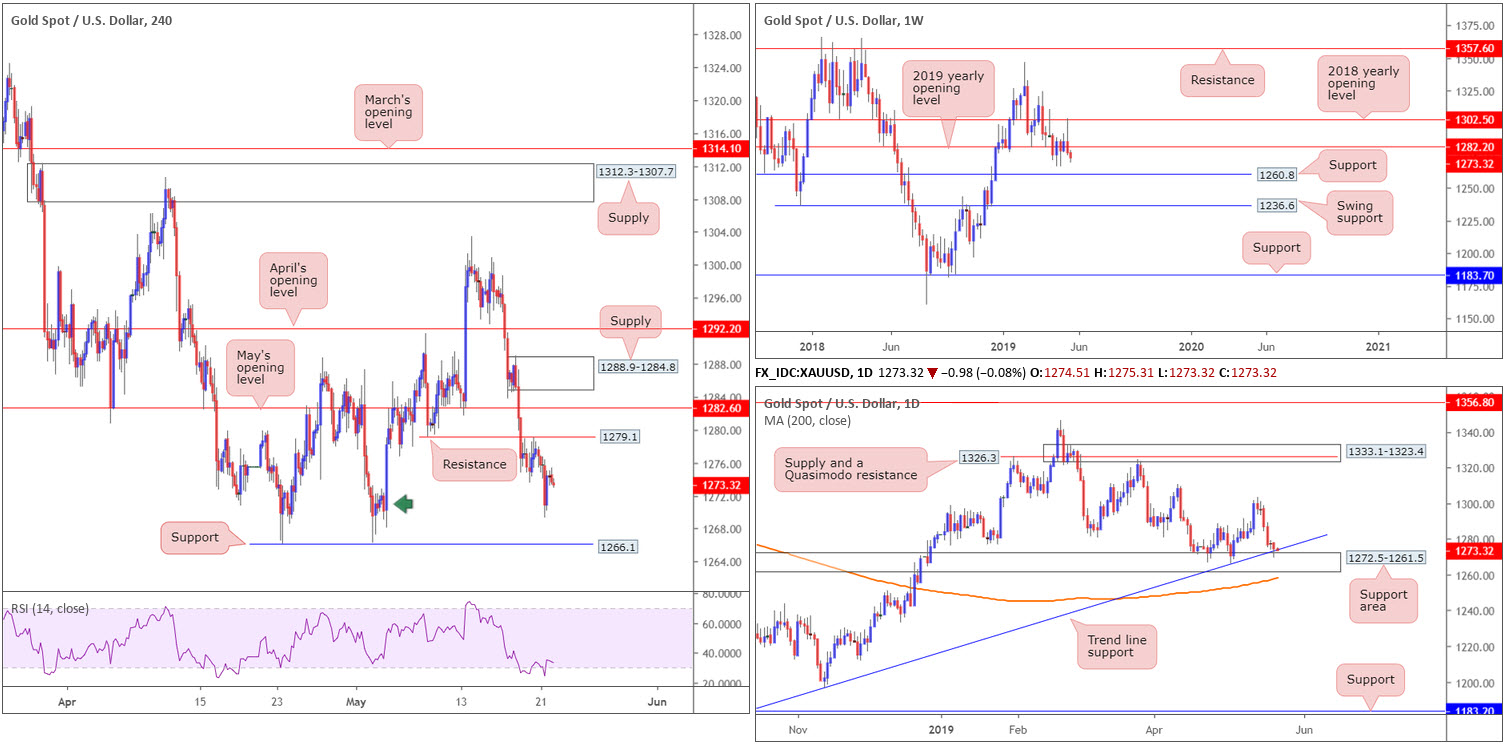
Weekly flow explores ground beneath its 2019 yearly opening level at 1282.2, and, according to our reading, is starved of support until connecting with 1260.8. Contrary to weekly direction, daily movement is shaking hands with a support area seen at 1272.5-1261.5. The zone boasts a reasonably solid history and merges with a trend line support taken from the low 1160.3. What’s also notable from a technical perspective is the unit remains above its 200-day SMA.
Closer analysis of the H4 timeframe has the candles rebounding from demand (green arrow) at 1268.1-1272.3. Beyond here, clear-cut support (double bottom) at 1266.1 is visible. Note the current H4 demand area also resides around the top edge of the daily support area at 1272.5-1261.5.
Areas of consideration:
As highlighted in previous reports, H4 demand marked with a green arrow at 1268.1-1272.3 was a point of interest for longs, owing to its connection to the top base of the current daily support area. Well done to any of our readers who managed to jump aboard the aforementioned H4 demand. The next upside target from this point falls in at resistance carved from 1279.1, followed by May’s opening level at 1282.6 – by that point you’ll also be trading around the underside of the 2019 yearly opening level mentioned above on the weekly timeframe at 1282.2.
The accuracy, completeness and timeliness of the information contained on this site cannot be guaranteed. IC Markets does not warranty, guarantee or make any representations, or assume any liability with regard to financial results based on the use of the information in the site.
News, views, opinions, recommendations and other information obtained from sources outside of www.icmarkets.com.au, used in this site are believed to be reliable, but we cannot guarantee their accuracy or completeness. All such information is subject to change at any time without notice. IC Markets assumes no responsibility for the content of any linked site. The fact that such links may exist does not indicate approval or endorsement of any material contained on any linked site.
IC Markets is not liable for any harm caused by the transmission, through accessing the services or information on this site, of a computer virus, or other computer code or programming device that might be used to access, delete, damage, disable, disrupt or otherwise impede in any manner, the operation of the site or of any user’s software, hardware, data or property.