


Key risk events today:
UK Average Earnings Index 3m/y; UK Claimant Count Change; UK Unemployment Rate; German ZEW Economic Sentiment; FOMC Member Bowman Speaks; US Core Retail Sales m/m; US Retail Sales m/m; Fed Chair Powell Speaks; FOMC Member Evans Speaks.
EUR/USD:
The euro concluded modestly weaker Monday, down 0.11% vs. the US dollar.
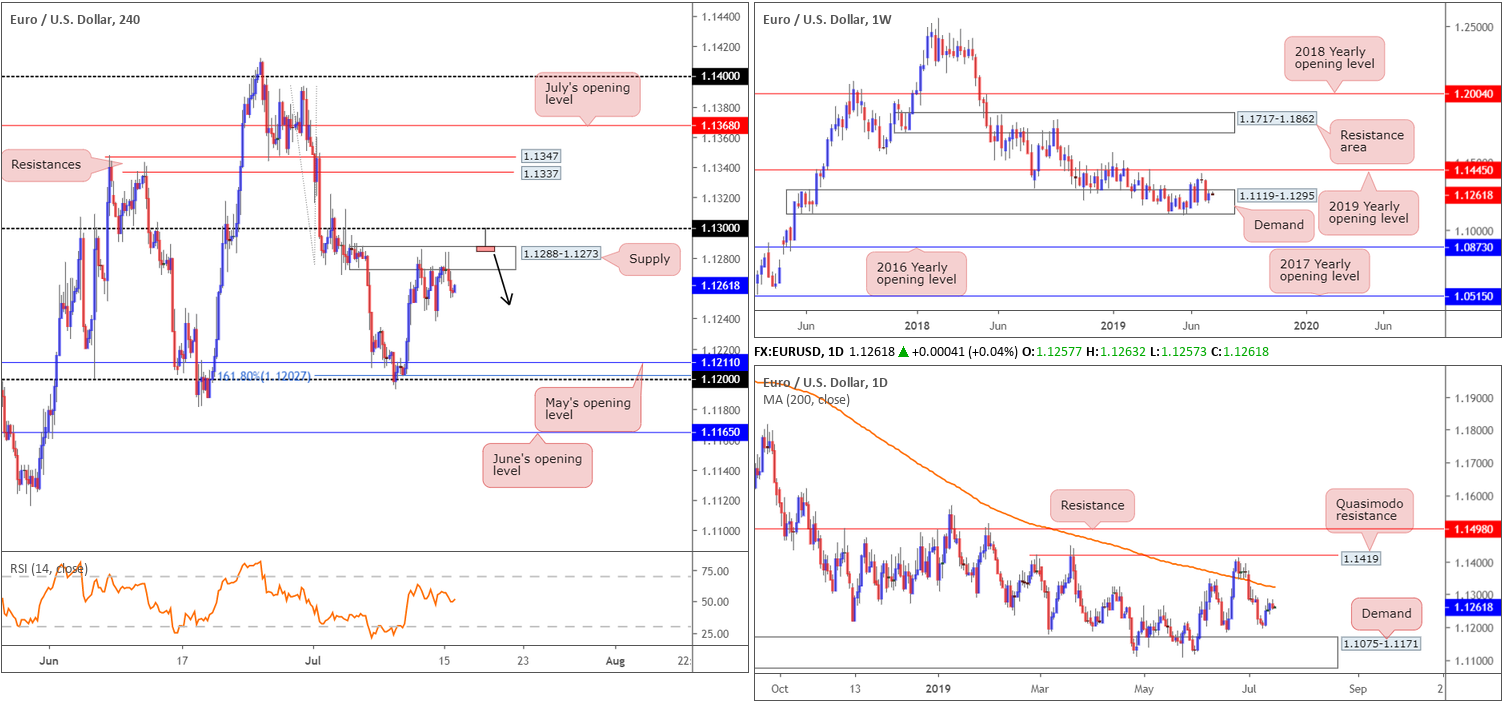
H4 supply remains in the spotlight at 1.1288-1.1273, holding price action lower since Thursday.
Considering Monday’s lacklustre movement, Monday’s briefing regarding H4 structure remains valid:
Overhead, nearby resistance resides nearby in the form of round number 1.13, with a break higher potentially setting the stage for a run towards the resistance area at 1.1347/1.1337. To the downside, the research team notes support resides at May’s opening level drawn from 1.1211, closely shadowed by a 161.8% Fibonacci ext. point at 1.1202 and the round number 1.12.
Undoubtedly, traders have short positions beneath the current supply, traditionally calling for protective stop-loss orders to be placed a couple of points above the zone.
Higher-timeframe analysis can also be taken from Monday’s briefing:
Since November 2018, long-standing weekly demand at 1.1119-1.1295 capped downside. As impressive as this is, impetus to the upside is lacking as price is unable to overthrow the 2019 yearly opening level (resistance) at 1.1445. Areas outside of the said barriers to be aware of fall in around the 2016 yearly opening level at 1.0873 (support) and a weekly resistance area drawn from 1.1717-1.1862.
As of the week’s close, price action is hovering nearby the top edge of the current demand area, threatening a breakout higher this week.
A closer reading of price action on the daily timeframe reveals the unit left demand at 1.1075-1.1171 (formed on May 17, 2017) unopposed early last week and explored higher ground. Further buying from this point has the 200-day SMA (orange – currently trading around 1.1328) to target.
Areas of consideration:
With little change in price seen, the research team’s outlook also remains unchanged here:
Having seen the H4 candles respond from supply at 1.1288-1.1273, this area is potentially ripe for a fakeout. In other words, a possible run through buy stops above the supply to sellers at 1.13 could be seen for a move lower. Remember, stop-loss orders above the supply are buy orders. Couple this with breakout buy orders and traders have themselves a tight collection of liquidity to sell into from 1.13.
An ideal scenario, therefore, is for H4 candles to chalk up a shooting star formation that pierces through the top edge of supply that tests 1.13 (see H4 chart for a visual representation). This, by and of itself, is a reasonably strong sell signal, targeting 1.12/1.1211.
GBP/USD:
The British pound failed to capitalise on last week’s modest recovery from six-month lows, down 0.45% against the US dollar Monday.
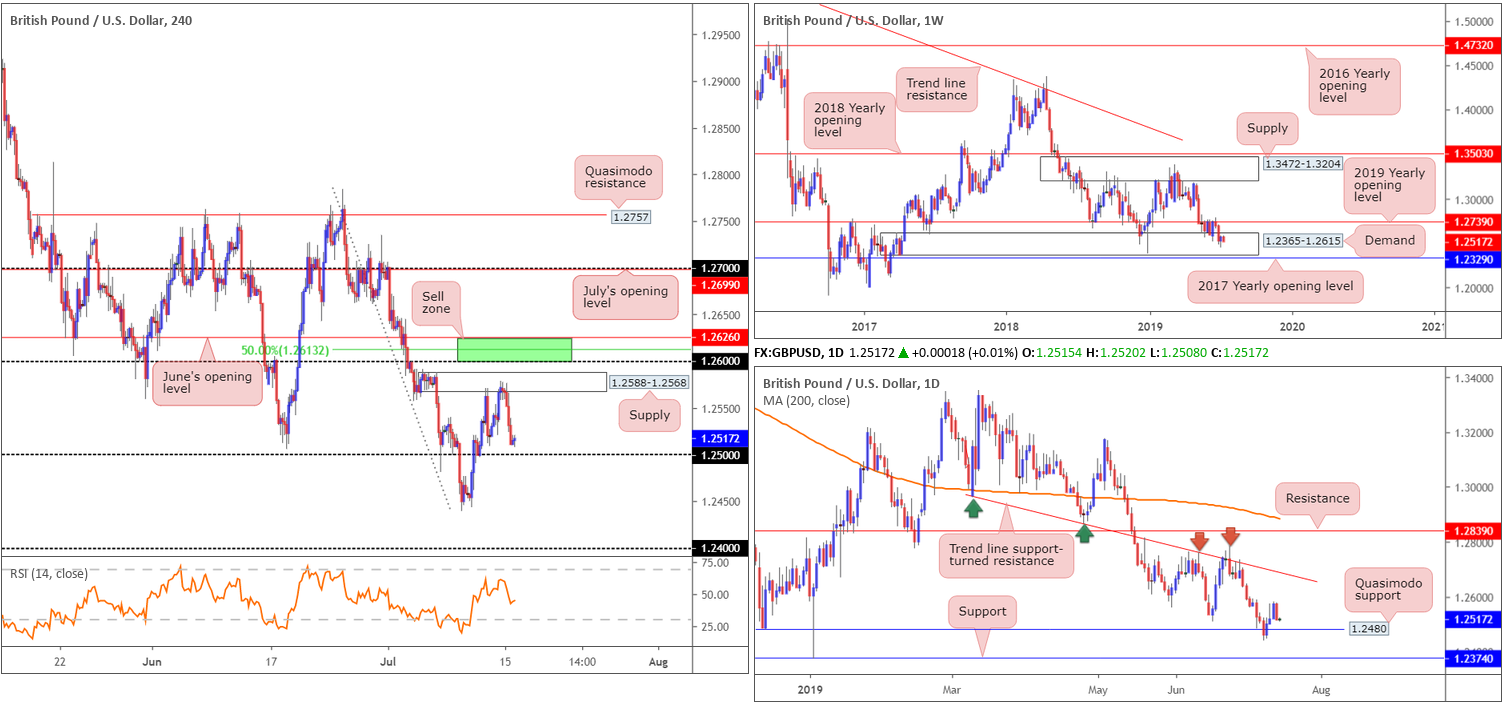
While Brexit uncertainties continue to weigh on the currency, today’s focus shifts to the UK jobs report and US monthly retail sales figures. Technically, H4 supply at 1.2588-1.2568 remains in the fight, with the unit wrapping up Monday closing a few points north of the 1.25 handle.
Beyond 1.25, H4 action may attempt an approach to the 1.2439 July 9 low, though before reaching this level, daily buyers may enter the fold off Quasimodo support at 1.2480. With respect to the daily timeframe, the next upside objective falls in around a trend line support-turned resistance (extended from the low 1.2960).
In terms of the market’s weekly position, as highlighted in Monday’s briefing, buyers and sellers have been warring for leadership between long-standing demand at 1.2365-1.2615 and the 2019 yearly opening level at 1.2739 (resistance) since late May. Despite recent movement drilling into the said demand, price action chalked up a reasonably strong recovery candle by way of a hammer formation last week, considered a bullish signal among the candlestick trading community.
Areas of consideration:
With the current H4 supply at 1.2588-1.2568 continuing to cap upside, focus shifts to 1.25 today. Between this figure and the daily Quasimodo support at 1.2480, we have ourselves a 20-point range in which to consider longs. Let’s also remain cognizant of weekly demand at 1.2365-1.2615 still exhibiting a presence. A H4 bullish candlestick signal printed from 1.2480/1.25, therefore, could be of interest to buyers today, targeting the noted H4 supply, followed by 1.2626/1.26 (green). Comprised of June’s opening level at 1.2626, a 50.0% retracement at 1.2613, the round number 1.26 and buy stops taken from traders short the noted supply as well as breakout buyers’ orders, this area has the potential to hold price action lower and is thus a sell zone by and of itself.
AUD/USD:
Bolstered on the back of Chinese data demonstrating signs the world’s second largest economy is stabilising (GDP growth in line, while fixed asset investment activity and industrial production printed small upside surprises), antipodeans remained the buyers’ favourite Monday, with the Australian dollar up 0.30% vs. the greenback.
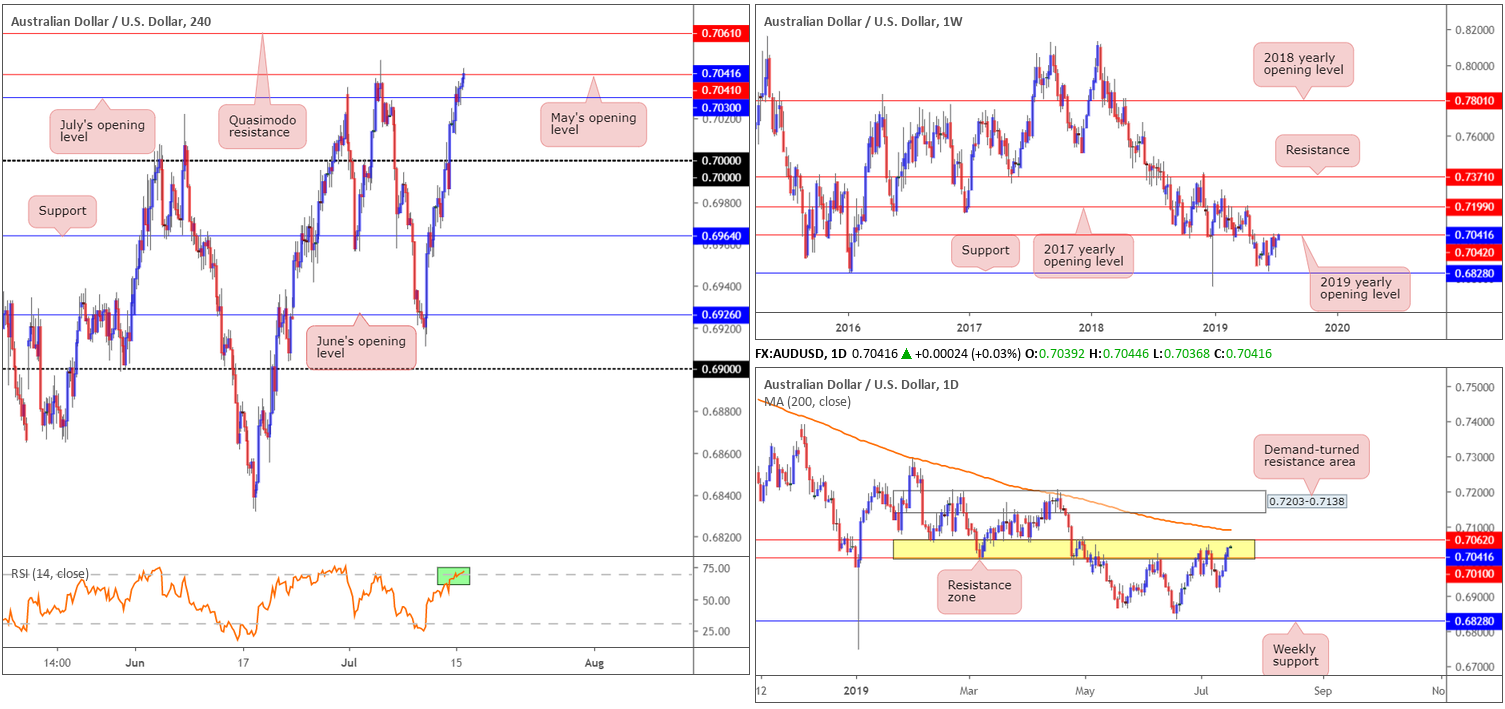
From a technical perspective, this lifted weekly flow to notable weekly resistance at 0.7042, the 2019 yearly opening level. 0.7042 stands a healthy chance of holding, having seen it serve well as support on several occasions in the past. Therefore, it is still worth keeping tabs on weekly support at 0.6828 should we press lower. In the event we push north this week, however, traders may wish to note the 2017 yearly opening level as the next upside target at 0.7199.
In terms of daily flow, current resistance forms by way of two resistances at 0.7062/0.7010 (yellow), effectively surrounding the 2019 yearly opening level on the weekly timeframe at 0.7042. As evident from the chart this morning, this area is under pressure thanks to yesterdays buying. As such, it may interest some traders to note the 200-day SMA (orange – 0.7091) lurking just north of the current daily resistance area.
A closer reading of price action on the H4 timeframe currently has the candles attempting to dethrone May’s opening level at 0.7041, with the next upside hurdle positioned nearby at Quasimodo resistance drawn from 0. 7061. Note this Quasimodo resistance also aligns with the top edge of the current daily resistance area at 0.7062. It might also be worth noting the RSI indicator is testing overbought territory (green).
Areas of consideration:
Having noted weekly resistance at 0.7042 enter the fold and daily price engaging with a resistance area at 0.7062/0.7010, as well as H4 action displaying resistance at May’s opening level from 0.7041, sellers may attempt to make an appearance.
Should the H4 candles press lower and close beneath July’s opening level at 0.7030, this likely unlocks the door towards key figure 0.70 for short-term selling opportunities. Beyond here, the research team has eyes on H4 support at 0.6964.
In addition to the above, traders should also prepare for the possibility of a run to H4 Quasimodo resistance at 0.7061, given its connection the top edge of the daily resistance area at 0.7062. This, by and of itself, is also a sell zone.
USD/JPY:
USD/JPY action wrapped up Monday’s session unchanged, ranging no more than 35 points on the day. In light of this lacklustre performance, much of the following will echo thoughts aired from Monday’s briefing:
From the weekly timeframe:
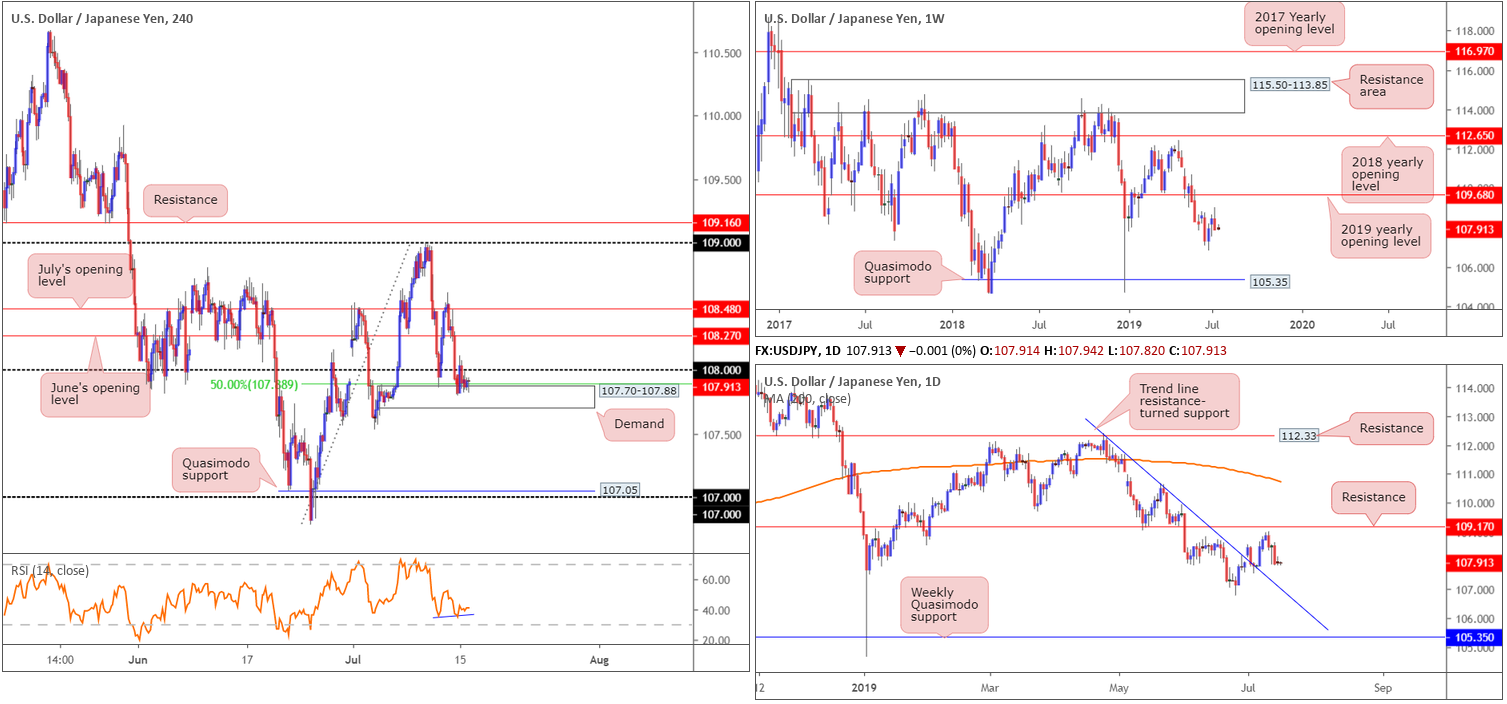
Breaking a two-week bullish phase, the US dollar rotated lower against the Japanese yen last week, engulfing the preceding candlestick’s body and erasing more than 55 points. According to technical structure on the weekly timeframe, resistance is set by way of the 2019 yearly opening level at 109.68 and support is not expected to emerge until reaching a Quasimodo formation at 105.35.
Daily timeframe:
Mid-week trading observed the USD/JPY decline in value, leaving resistance at 109.17 unchallenged. The next port of call, in terms of support, can be seen in the form of a trend line resistance-turned support (extended from the high 112.40). Beyond here, the 106.78 June 25 low is seen, followed then by the weekly Quasimodo support mentioned above 105.35.
And from the H4 timeframe:
Bolstered by a 50.0% retracement level at 107.88 and the RSI chalking up mild positive divergence (blue line), H4 demand at 107.70-107.88 remains in the fight, with a move back above 108 potentially on the cards.
Before pressing the buy button, though, do take into account both weekly and daily timeframes display room to explore lower ground, and scope above 108 is limited by July and June’s opening levels seen nearby at 108.48 and 108.27, respectively.
Should the noted demand fail to hold price, Quasimodo support at 107.05 is seen as the next downside target on this scale, shadowed closely by the 107 handle.
Areas of consideration:
Although buying above 108 may appeal to some traders, further selling appears the more likely path according to the overall technical picture. A H4 close below H4 demand at 107.70-107.88, preferably followed up with a retest in the shape of a bearish candlestick configuration (entry and risk levels can be determined according to this structure), may fuel a move towards the H4 Quasimodo support at 107.05. Note this level also aligns closely with the daily trend line resistance-turned support.
USD/CAD:
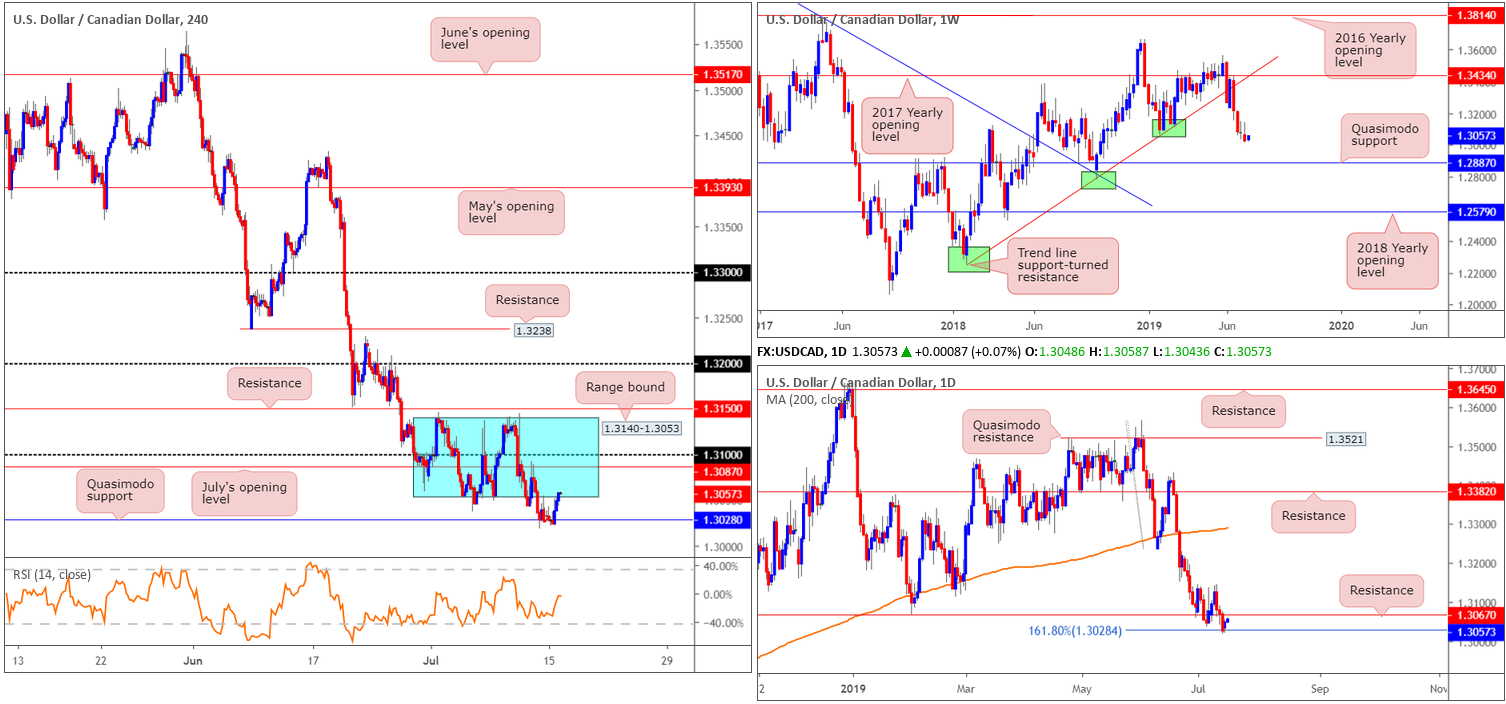
H4 Quasimodo support at 1.3028, which happens to align with a 161.8% Fibonacci extension point at 1.3028 on the daily timeframe, held price action higher Monday. With the US dollar index marginally advancing northbound and WTI prices trading beneath its $60.00/bbl mark, the H4 candles re-entered its range between 1.3140-1.3053 (blue), with a possible move towards July’s opening level at 1.3087 materialising, closely followed by the 1.31 handle.
Before reaching the said H4 resistances, though, traders may want to take into account daily resistance at 1.3067 might contain upside. This – coupled with weekly price displaying limited support until reaching a Quasimodo formation at 1.2887 – certainly places somewhat of a bearish cloud over this market right now.
Areas of consideration:
As noted in Monday’s technical outlook, entering long in this market, particularly at current price, is an incredibly chancy move given resistances seen on the H4 timeframe and nearby on the daily timeframe at 1.3067.
Instead of attempting to buy, traders may want to consider selling 1.31/1.3087 on the H4 timeframe, knowing you have weekly directional flow on your side, as well as sellers likely entering the fight from the daily timeframe at resistance drawn in a little lower on the curve from 1.3067.
As usual when dealing with round numbers, however, traders are urged to consider waiting and seeing if H4 price chalks up a bearish candlestick pattern prior to pulling the trigger. Not only will this help identify seller intent, it’ll also provide entry and risk levels to work with.
USD/CHF:
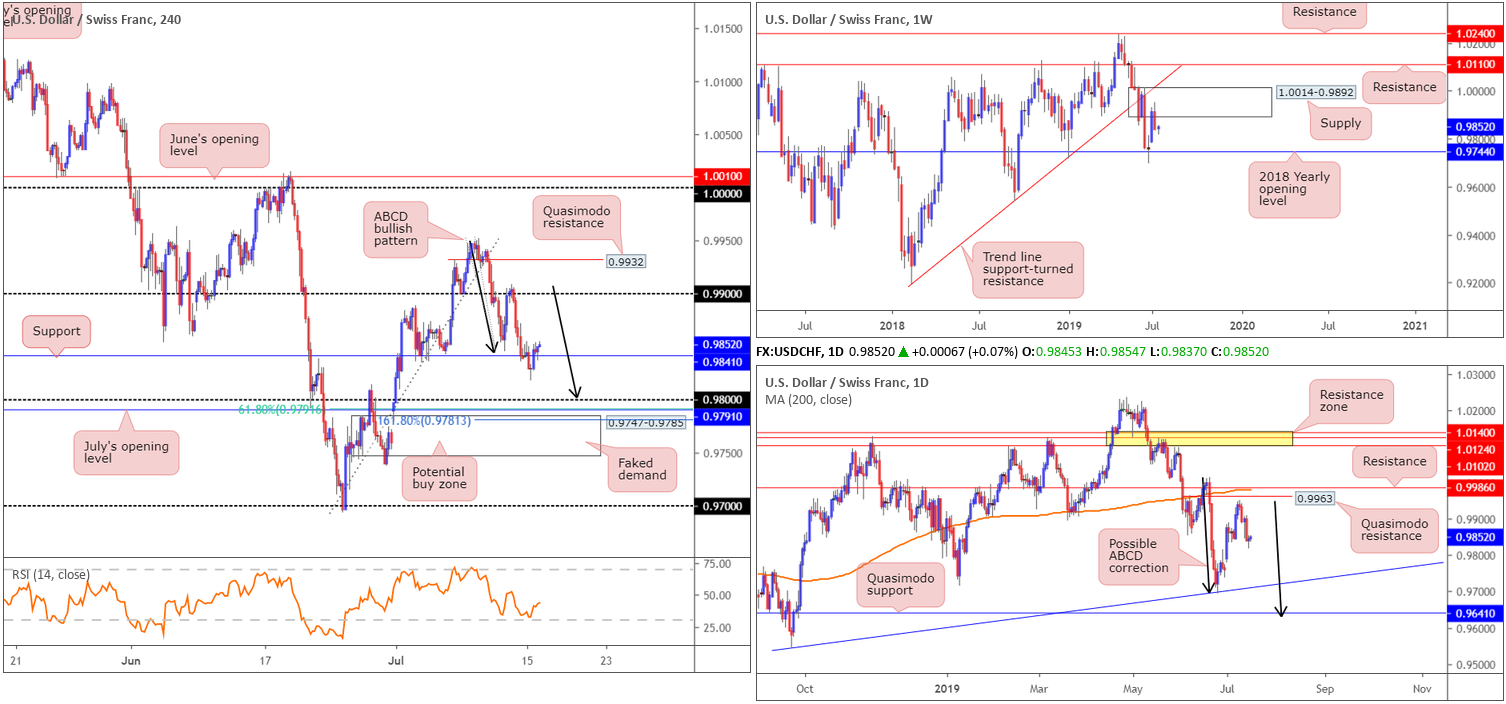
The US dollar managed to eke out marginal gains Monday, up 0.07% vs. the Swiss franc. Despite a run to session lows of 0.9817 amid London, US hours observed the USD/CHF recover and reclaim H4 support at 0.9841.
Beneath the said H4 support, the 0.98 handle is next in the firing range as potential support, closely trailed by July’s opening level at 0.9791 and a 61.8% Fibonacci retracement value as well as a ‘faked’ demand zone at 0.9747-0.9785. Another interesting point to note is the approach to 0.98. Should continued selling be seen, an ABCD bullish pattern will complete at 0.98 (black arrows), with its 161.8% Fibonacci ext. point residing within the upper boundary of 0.9747-0.9785 at 0.9781. To the upside, nevertheless, we have the 0.99 handle in sight.
In regards to higher-timeframe structure, Monday’s briefing had the following to report:
The US dollar surrendered a portion of recent gains off the 2018 yearly opening level at 0.9744 last week, following a rotation lower out of weekly supply at 1.0014-0.9892. While this could lead to a revisit of 0.9744, traders may also find use in noting the weekly trend line support-turned resistance (extended from the low 0.9187), closely followed by weekly resistance at 1.0110, should we turn higher this week.
Daily perspective:
Leaving Quasimodo resistance at 0.9963 unopposed, the daily candles turned south last week. With respect to the next support target, trend line support extended from the low 0.9542 may be an option, followed then by Quasimodo support at 0.9641. What’s also notable from a technical perspective here is the ABCD bullish formation at 0.9629 (black arrows).
Areas of consideration:
As underlined in Monday’s report:
Longer-term flow suggests selling could be in store. Not only do we have room to explore lower levels on the daily timeframe, we’re also coming from a weekly supply at 1.0014-0.9892.
Medium-term flow, on the other hand, may witness a bounce higher from the 0.98 region on the H4 scale. Generally, when considering ABCD patterns, which merges with 0.98 (see above), the first take-profit target can be drawn from the 38.2% Fibonacci retracement of legs A-D. However, traders interested in buying 0.98 are also urged to take into account we could witness a fakeout into 0.9747-0.9785 before rotating higher. Stop-loss placement, therefore, is best positioned beneath this zone at 0.9747.
Dow Jones Industrial Average:
US equities nudged to fresh record highs of 27388 Monday amid cautious trading as investors awaited the first quarterly earnings reports. The modest advance extended a record run, fuelled last week by expectations for looser monetary policy at the Federal Reserve. Monday saw the Dow Jones Industrial average add 0.10%; the S&P 500 add 0.02% and the tech-heavy Nasdaq 100 advance 0.30%.
With limited movement observed yesterday, points aired in yesterday’s briefing remain at the forefront of our analysis today:
From the weekly timeframe, Monday’s report had the following to say:
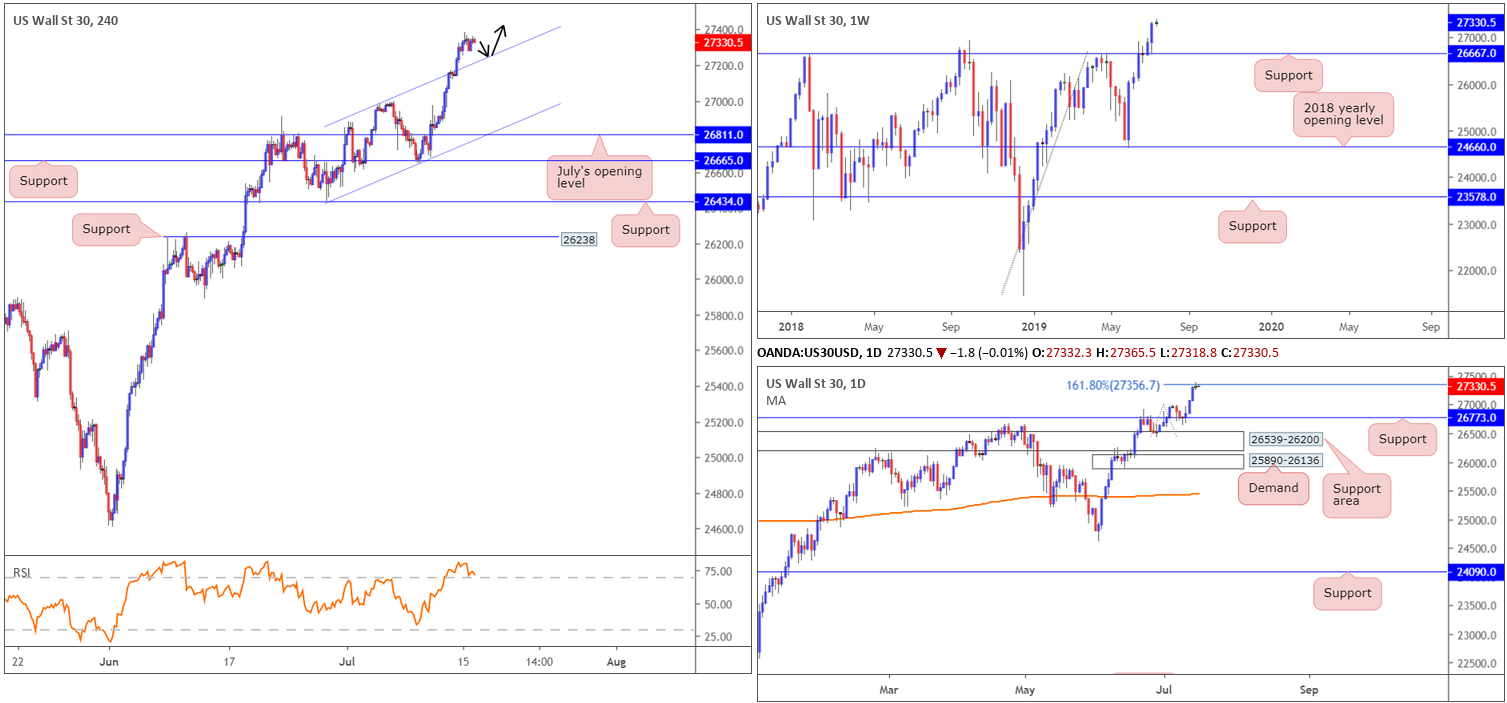
Aside from a brief spell of indecision three weeks back, the Dow Jones Industrial Average has emphasised a strong bullish tone since shaking hands with the 2018 yearly opening level at 24660 in early June. Taking out resistance at 26667 and shortly after retesting it as support propelled the index to fresh record highs of 27321 last week. With limited resistance in sight until connecting with 28070 (not visible on the screen), a 127.2% Fibonacci ext. point taken from the low 21425, additional buying could be seen over the coming weeks.
Daily perspective:
In similar fashion to weekly structure, price action retested support at 26773 in the shape of a hammer formation and advanced to fresh record highs last week. Resistance on this timeframe, however, is in play at 27356: the 161.8% Fibonacci ext. point.
H4 perspective:
Technically, we broke above the ascending channel’s upper limit (extended from the high 26972) Friday and consolidated on Monday. With the 161.8% Fibonacci ext. point at 27356 marked as resistance on the daily timeframe, the unit may pullback and retest the recently broken channel resistance-turned support for a move higher today/early week.
Areas of consideration:
With the index strongly entrenched within an uptrend at present, entering short from 27356 is chancy on the daily timeframe. Instead, as briefly highlighted above, focus has shifted to a potential retest of the H4 channel resistance-turned support. To be on the safe side, traders are encouraged to wait for a H4 bullish candlestick formation to develop before entering long (entry and risk levels can be determined according to the candle’s structure). This is simply due to the possibility of aggressive selling entering the market off 27356.
XAU/USD (GOLD):
Spot gold traded mostly subdued Monday, ranging nearly $12. From a technical viewpoint, little change was seen, particularly on the H4, daily and weekly timeframes.
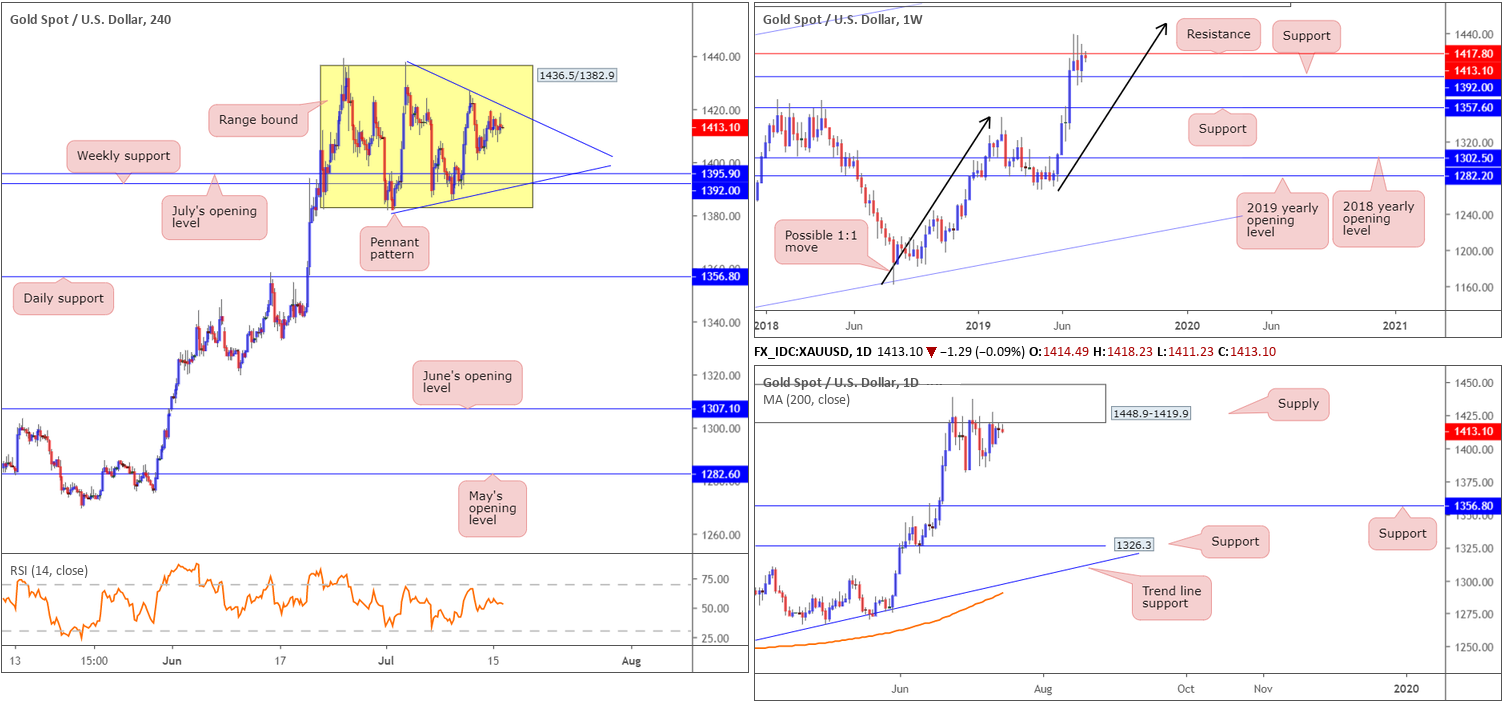
From the weekly timeframe, we can see the unit kissing the underside of resistance at 1417.8, which has capped upside for three weeks. Further upside from current price could eventually cross paths with a 1:1 correction (black arrows) around 1453.2 shaped from the 1160.3 August 13 low, whereas a move sub 1392.0 (nearby support) has another layer of support in view at 1357.6.
The story on the daily timeframe, as underscored in Monday’s piece, has the candles testing the lower edge of a supply zone at 1448.9-1419.9. Note the weekly resistance level at 1417.8 resides just beneath the said supply zone. The next downside target on the daily scale falls in around at 1356.8.
Closely examining price action on the H4 timeframe, bullion continues to trade within a range.
Taken from Monday’s report:
Overall, the H4 candles have been carving out a consolidation between 1436.5/1382.9 since June 25, bolstered by weekly support at 1392.0 and July’s opening level on the H4 timeframe at 1395.9. Another development to potentially consider is the pennant pattern (blue levels – 1437.7/1381.9). This is generally considered a continuation pattern, and therefore may eventually pressure the unit to the upside. This formation is also evident on the daily timeframe, too.
Areas of consideration:
Also taken from Monday’s report:
As of current market structure on the H4, daily and weekly timeframes, the research team notes limited opportunity to trade at present. Aside from the daily timeframe suggesting a move lower from supply at 1448.9-1419.9, both the H4 and daily timeframes are in a range and in need of a breakout.
With that being said, traders may wish to attempt to trade between the H4 range limits, either the rectangle formation between 1436.5/1382.9 or the current H4 pennant pattern. Either way, it is wise to ensure you have reasonable risk/reward in place before pulling the trigger, and preferably confirmed by bullish/bearish candlestick structure (entry and risk levels can then be determined according to its extremes).
The accuracy, completeness and timeliness of the information contained on this site cannot be guaranteed. IC Markets does not warranty, guarantee or make any representations, or assume any liability with regard to financial results based on the use of the information in the site.
News, views, opinions, recommendations and other information obtained from sources outside of www.icmarkets.com.au, used in this site are believed to be reliable, but we cannot guarantee their accuracy or completeness. All such information is subject to change at any time without notice. IC Markets assumes no responsibility for the content of any linked site.
The fact that such links may exist does not indicate approval or endorsement of any material contained on any linked site. IC Markets is not liable for any harm caused by the transmission, through accessing the services or information on this site, of a computer virus, or other computer code or programming device that might be used to access, delete, damage, disable, disrupt or otherwise impede in any manner, the operation of the site or of any user’s software, hardware, data or property.