


Key risk events today:
Limited.
(Previous analysis as well as outside sources – italics).
EUR/USD:
Weekly gain/loss: -0.17%
Weekly close: 1.0817
Weekly perspective:
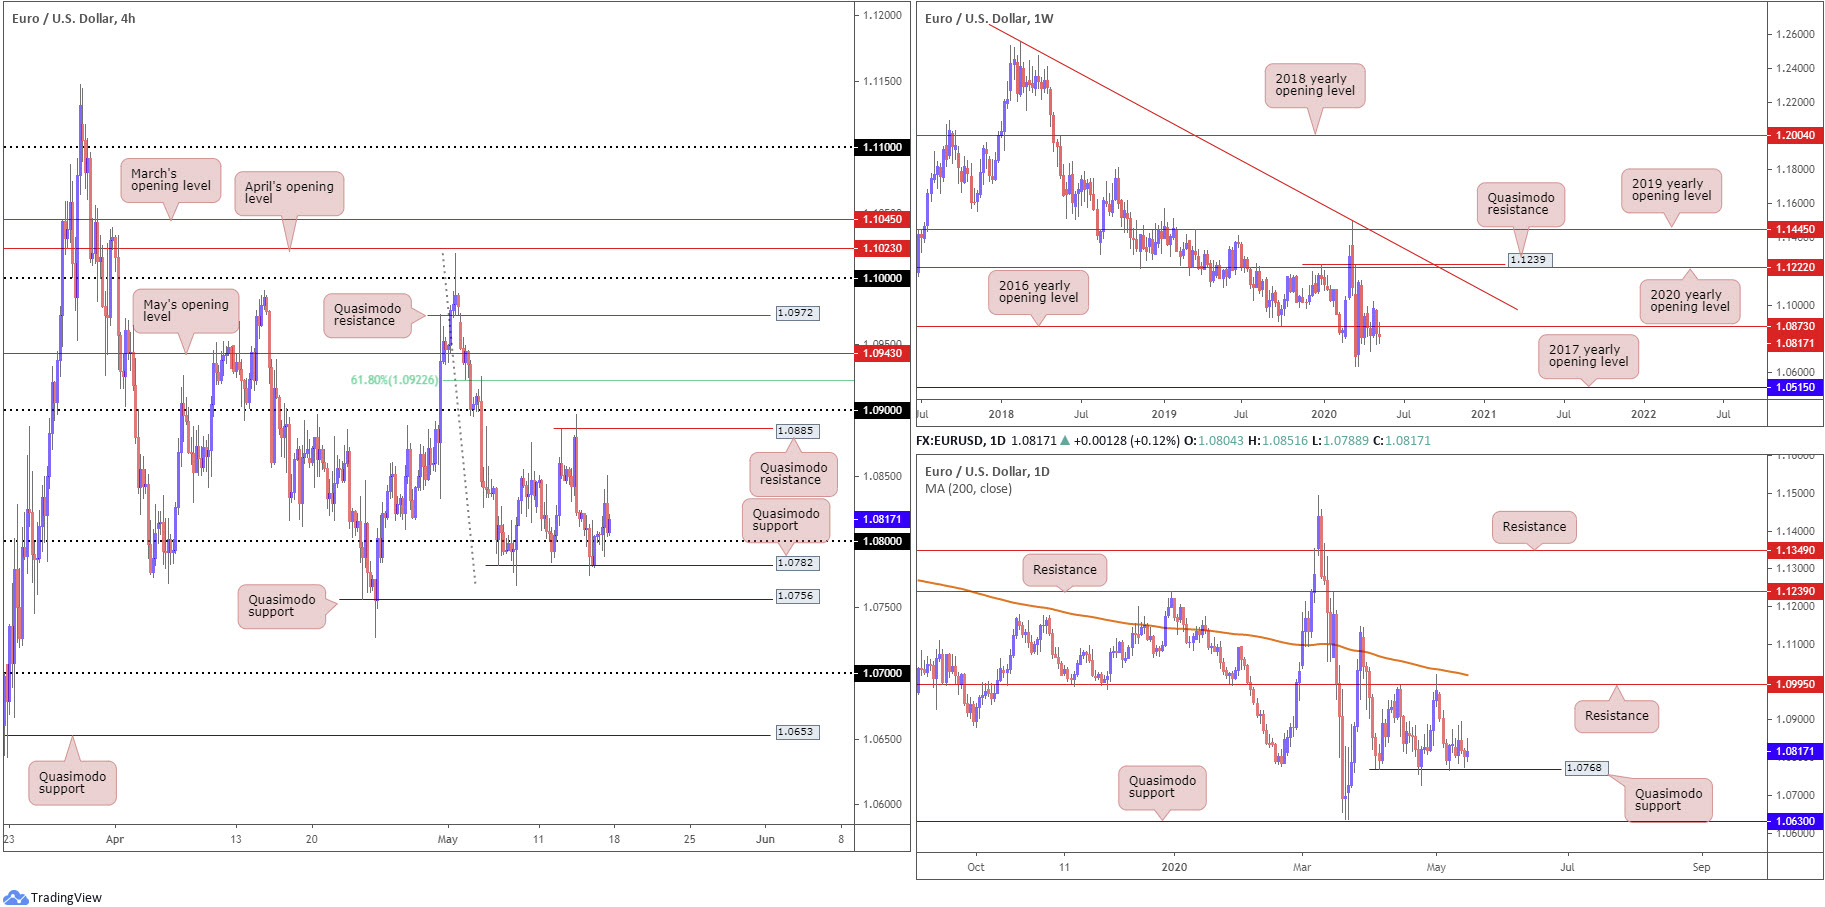
EUR/USD retained a modest offer over the course of last week, testing and holding south of the 2016 yearly opening level at 1.0873.
A bump lower this week could have multi-year lows enter at 1.0635, while firming may eventually witness the 2020 yearly opening level at 1.1222 make a play.
Overall, we can also see the pair has remained in a long-term downtrend since topping in early 2018.
Daily perspective:
Price movement on the daily timeframe has been somewhat sluggish of late, shifting between gains and losses ahead of Quasimodo support from 1.0768.
Traders will note last Thursday’s reaction (May 7) off 1.0768 shaped a borderline bullish tone, unable to conquer 1.0850. Traders, therefore, are likely preparing for the possibility of an extension lower this week, potentially shining the spotlight on another Quasimodo support coming in at 1.0630.
H4 perspective:
Initial downside sub 1.08 was reversed heading into US trading Friday, reclaiming 1.08+ status after retail sales tumbled 16.4% in April, according to the US Census Bureau.
Buying, nonetheless, was short-lived. The pair found thin air above 1.0850, retreating to lows just north of 1.08 and consequently giving back the vast majority of earlier gains.
To the upside on the H4 scale, aside from 1.0850, resistance is visible from a Quasimodo formation at 1.0885, closely followed by 1.09. Breaking down beneath 1.08 this week, however, has Quasimodo support to target at 1.0782, with a break exposing another layer of Quasimodo support from 1.0756.
Areas of consideration:
Support off daily and H4 Quasimodo formations at 1.0768/1.0756 may develop in the week ahead. Yet, buyers face downside pressure from weekly sellers beneath 1.0873 and possible resistance off 1.0782 (H4 Quasimodo support) and 1.08.
Any sustained move under 1.0756 may appeal to breakout sellers, targeting the 1.07 handle. All three timeframes, assuming a daily close forms beneath 1.0768, will then be trading in harmony, perhaps highlighting a high-probability bearish scenario.
GBP/USD:
Weekly gain/loss: -2.43%
Weekly close: 1.2099
Weekly perspective:
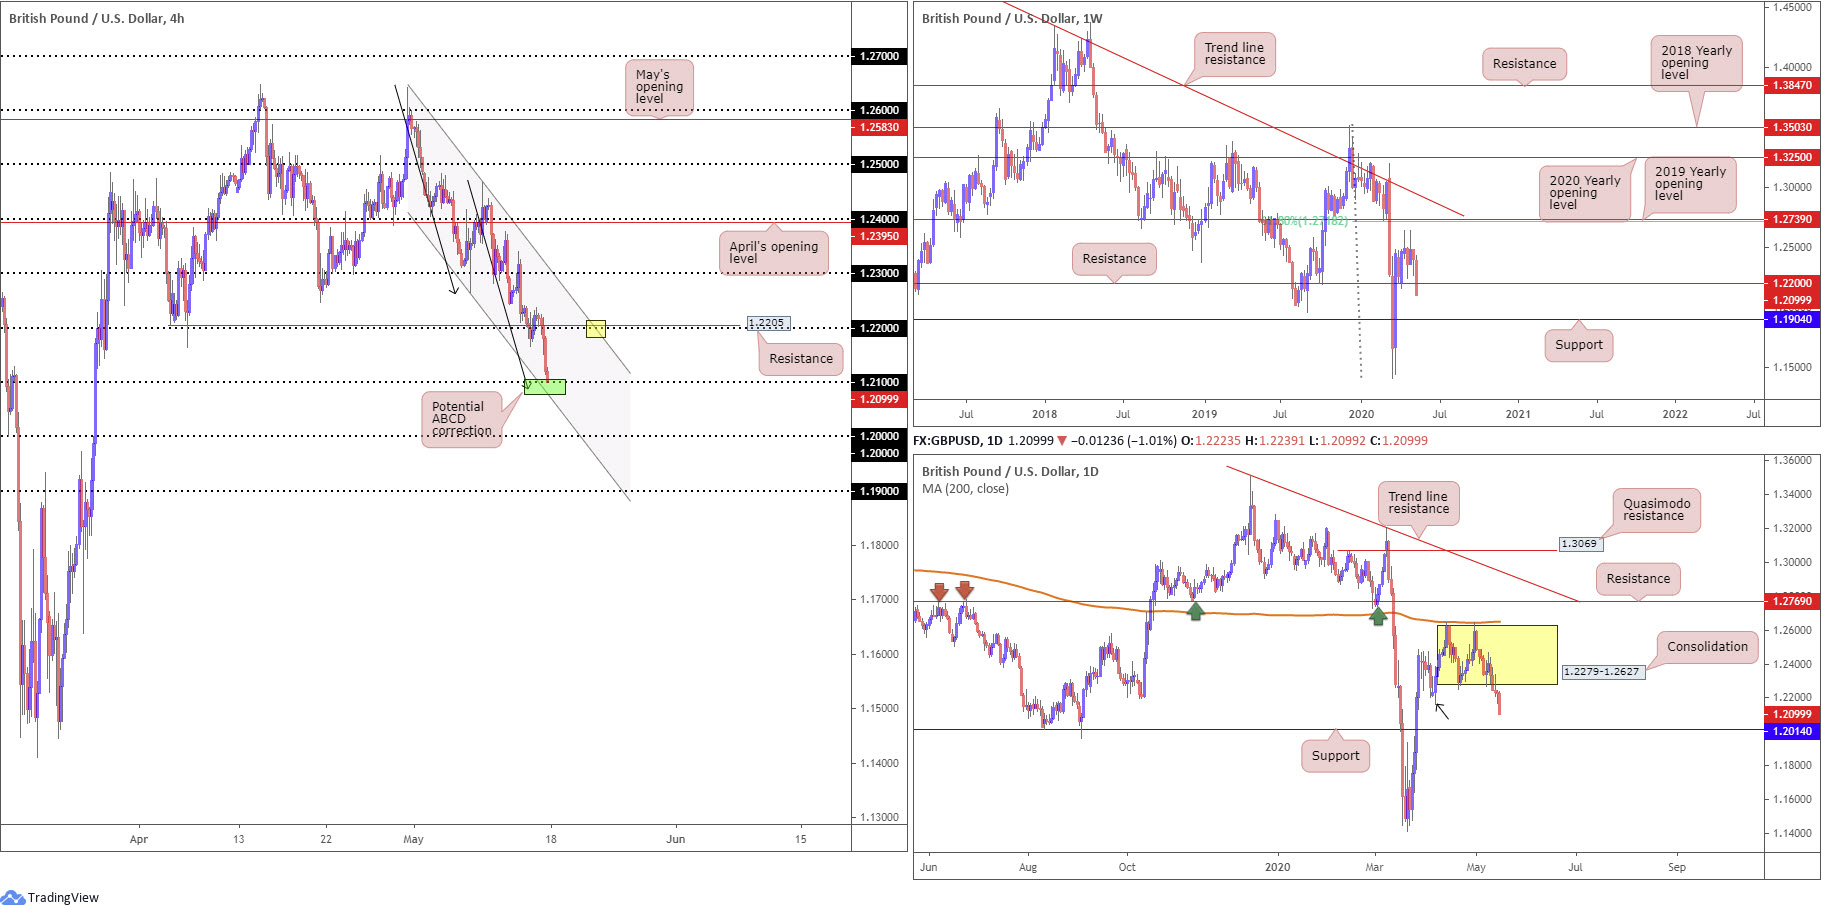
The British pound sunk 300 pips against the greenback last week, with support at 1.2200 (now a serving resistance) doing little to turn the dial.
With the pair closing the week at fresh monthly lows of 1.2099, additional downside may call for support at 1.1904 to make a show this week, though traders are urged to pencil in the possibility of a retest forming at 1.2200 before stepping lower.
Daily perspective:
Price action navigated waters south of a familiar consolidation zone between 1.2279-1.2627 (yellow) in recent trade, with the move perhaps exacerbated on the back of breakout selling beneath the 1.2163 April 7 low (black arrow).
While the weekly timeframe exhibits scope to run towards 1.1904, the daily chart positions support at 1.2014.
H4 perspective:
Cementing its fifth consecutive losing session Friday, despite an earnest attempt at recovery following dismal retail sales data out of the US, sterling wrapped up the day down 1.00%.
Price action eclipsed bids around 1.22 and delivered the H4 candles into 1.21, a level that draws a close connection to an ABCD correction (black arrows) at 1.2085 and channel support, also surfacing just beneath 1.21, extended from the low 1.2266.
Any sustained move below 1.21 this week places the key figure 1.20 on the hit list, along with daily support mentioned above at 1.2014.
Areas of consideration:
1.21 will likely be on the watchlist for many this morning, having noted local confluence by way of an ABCD bullish correction and channel support (green). A response off 1.21 may tempt a run back to 1.22. The point at which the round number merges with channel resistance, extended from the high 1.2643, and H4 resistance at 1.2205 (yellow) marks an appealing upside target for longs, as well as a platform for sellers to consider.
The key figure 1.20 is also worth underlining this week. Not only is the level widely watched, it joins closely with daily support from 1.2014.
AUD/USD:
Weekly gain/loss: -1.79%
Weekly close: 0.6413
Weekly perspective:
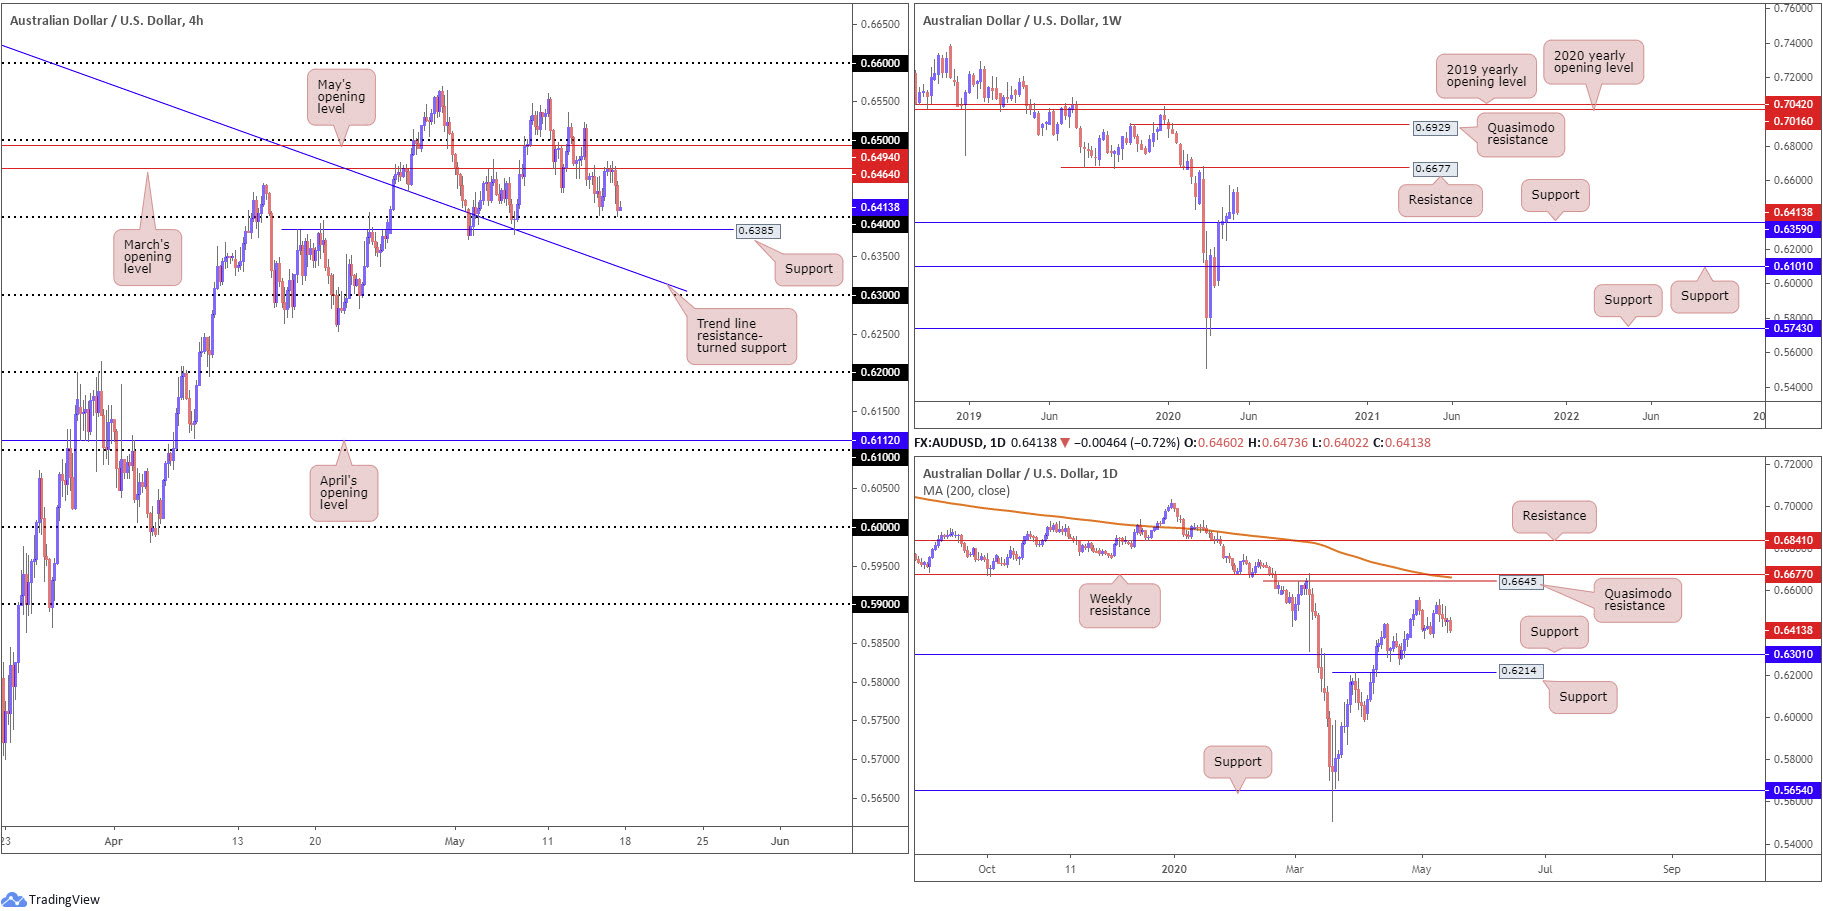
Upside momentum diminished considerably last week, snapping a five-week bullish phase and seizing the prior week’s gains.
Recent downside implies a retest at support from 0.6359 may form this week. With respect to resistance, traders’ crosshairs are still likely fixed on 0.6677.
Overall, longer-term traders will also note we have been trending lower since the start of 2018, therefore recognising that the move from multi-year lows at 0.5506 could simply be a bulky pullback before attempting a run to fresh lows.
Daily perspective:
Technical structure on the daily timeframe has local support sited around 0.6370ish, with the possibility of the April 30 high at 0.6569 serving up resistance.
Major resistance can be seen at a Quasimodo formation from 0.6645, parked just ahead of the weekly resistance level mentioned above at 0.6677 and a 200-day SMA (orange – 0.6664).
Beneath 0.6370, 0.6301 and 0.6214 are also noted as possible supports.
H4 perspective:
Undermined by a confident dollar bid above 100.00, the Australian dollar sunk 0.7% Friday and produced a daily bearish outside day.
Against the backdrop of longer-term flow, intraday action met strong selling pressure off March’s opening level at 0.6464 and clocked lows a few pips ahead of the 0.64 handle. Note this level also brings with it a nearby support at 0.6385.
Space beyond 0.6385 has a trend line resistance-turned support, taken from the high 0.7031, in sight, closely followed by 0.63.
Areas of consideration:
0.64 boasts appeal this week, bringing together H4 support at 0.6385.
Although the H4 scale displays room to explore ground beneath 0.6385, weekly support at 0.6359 may hinder breakout sellers and form a bear trap.
In the event we do reach 0.63ish this week, buyers may make a showing as the level comes with a H4 trend line resistance-turned support and a daily support from 0.6301.
USD/JPY:
Weekly gain/loss: +0.43%
Weekly close: 107.07
Weekly perspective:
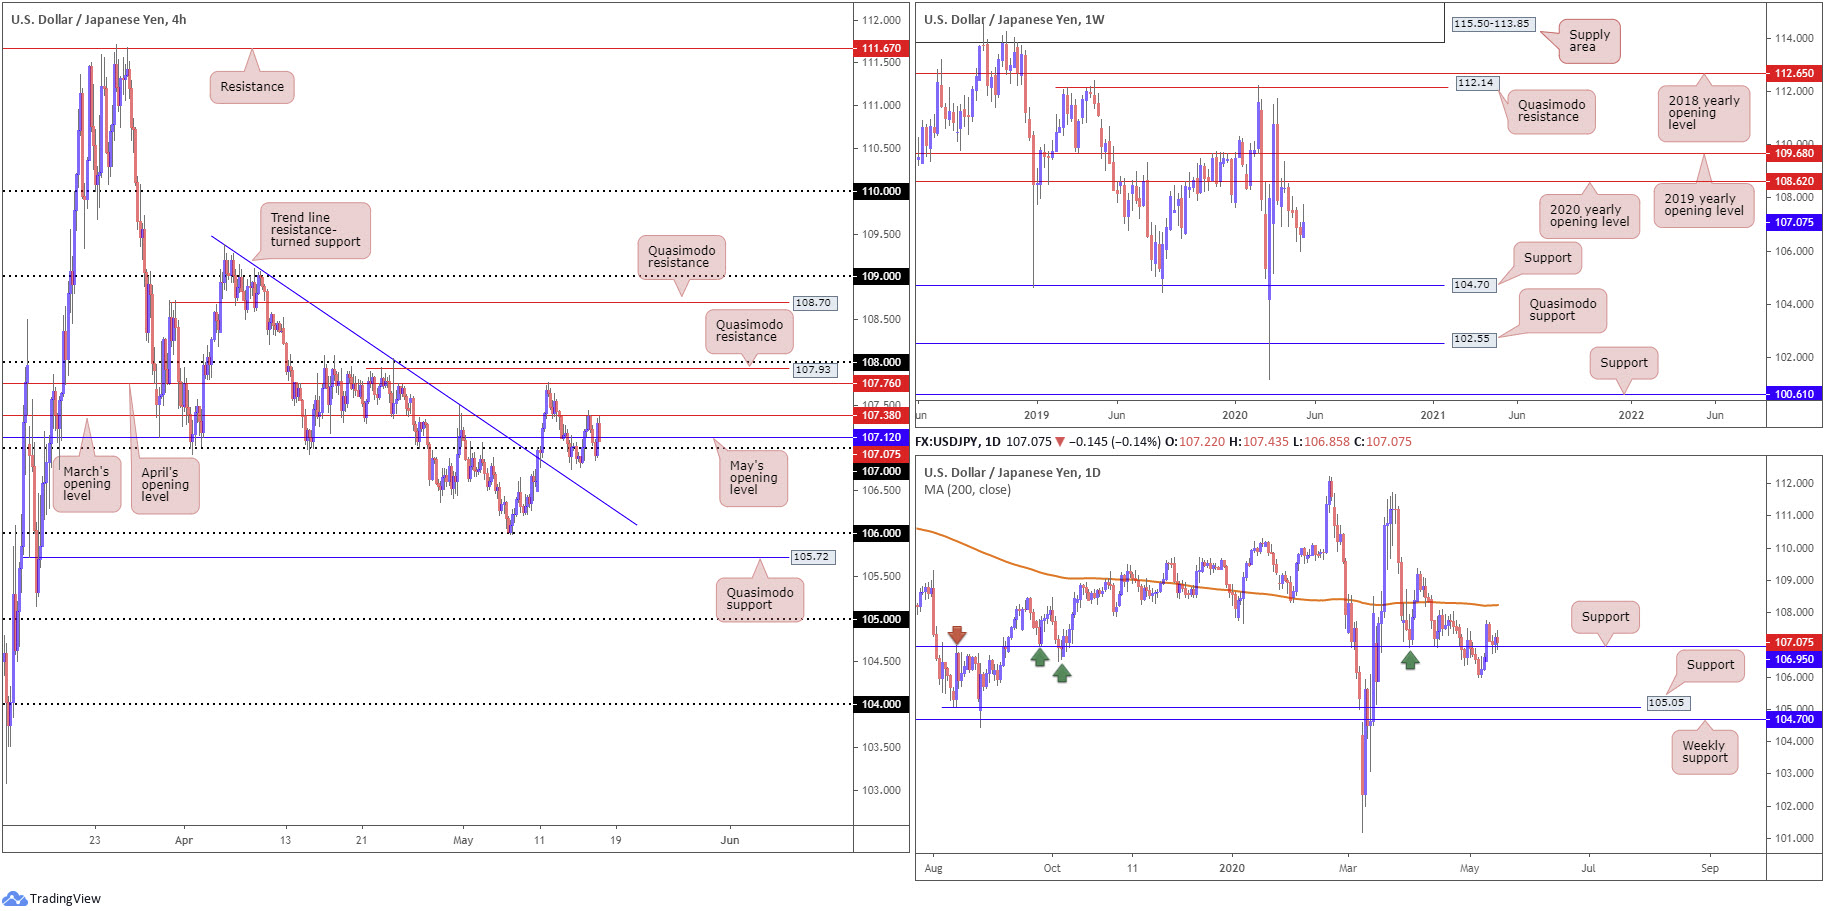
Despite underscoring a modest recovery on the week, a move that snapped a five-week bearish phase, price continues to reflect a bearish tone south of the 2020 yearly opening level at 108.62, with 104.70 positioned as the next support target.
Daily perspective:
Technical action on the daily timeframe recently shook hands with support at 106.95, after dipping from three-week tops at 107.76.
Although buyers have yet to print anything meaningful from 106.95, current movement still throws the 200-day SMA (orange – 108.23) into the firing range as possible resistance this week.
H4 perspective:
Gloomy retail sales data out of the US sent USD/JPY tumbling through 107 in early US trade Friday, though swiftly turned off lows at 106.85 and regained a footing above 107 and May’s opening level at 107.12.
Reclaiming 107+ status and dethroning May’s opening level positions March’s opening level at 107.38 in sight, with a break revealing April’s opening level at 107.76, Quasimodo resistance at 107.93 and ultimately the 108 handle.
Areas of consideration:
Daily support at 106.95 and the 107 handle on the H4 timeframe may be enough to tempt further recovery this week. Conservative buyers, however, will likely seek a H4 close above March’s opening level at 107.38 before engaging.
Failure to hold a bid above 107 could see the pendulum swing towards a run to H4 trend line resistance-turned support, taken from the high 109.38, and maybe even the 106 handle. As such, a daily close beneath 106.95 could serve as a cue to consider bearish strategies.
USD/CAD:
Weekly gain/loss: +1.36%
Weekly close: 1.4105
Weekly perspective:
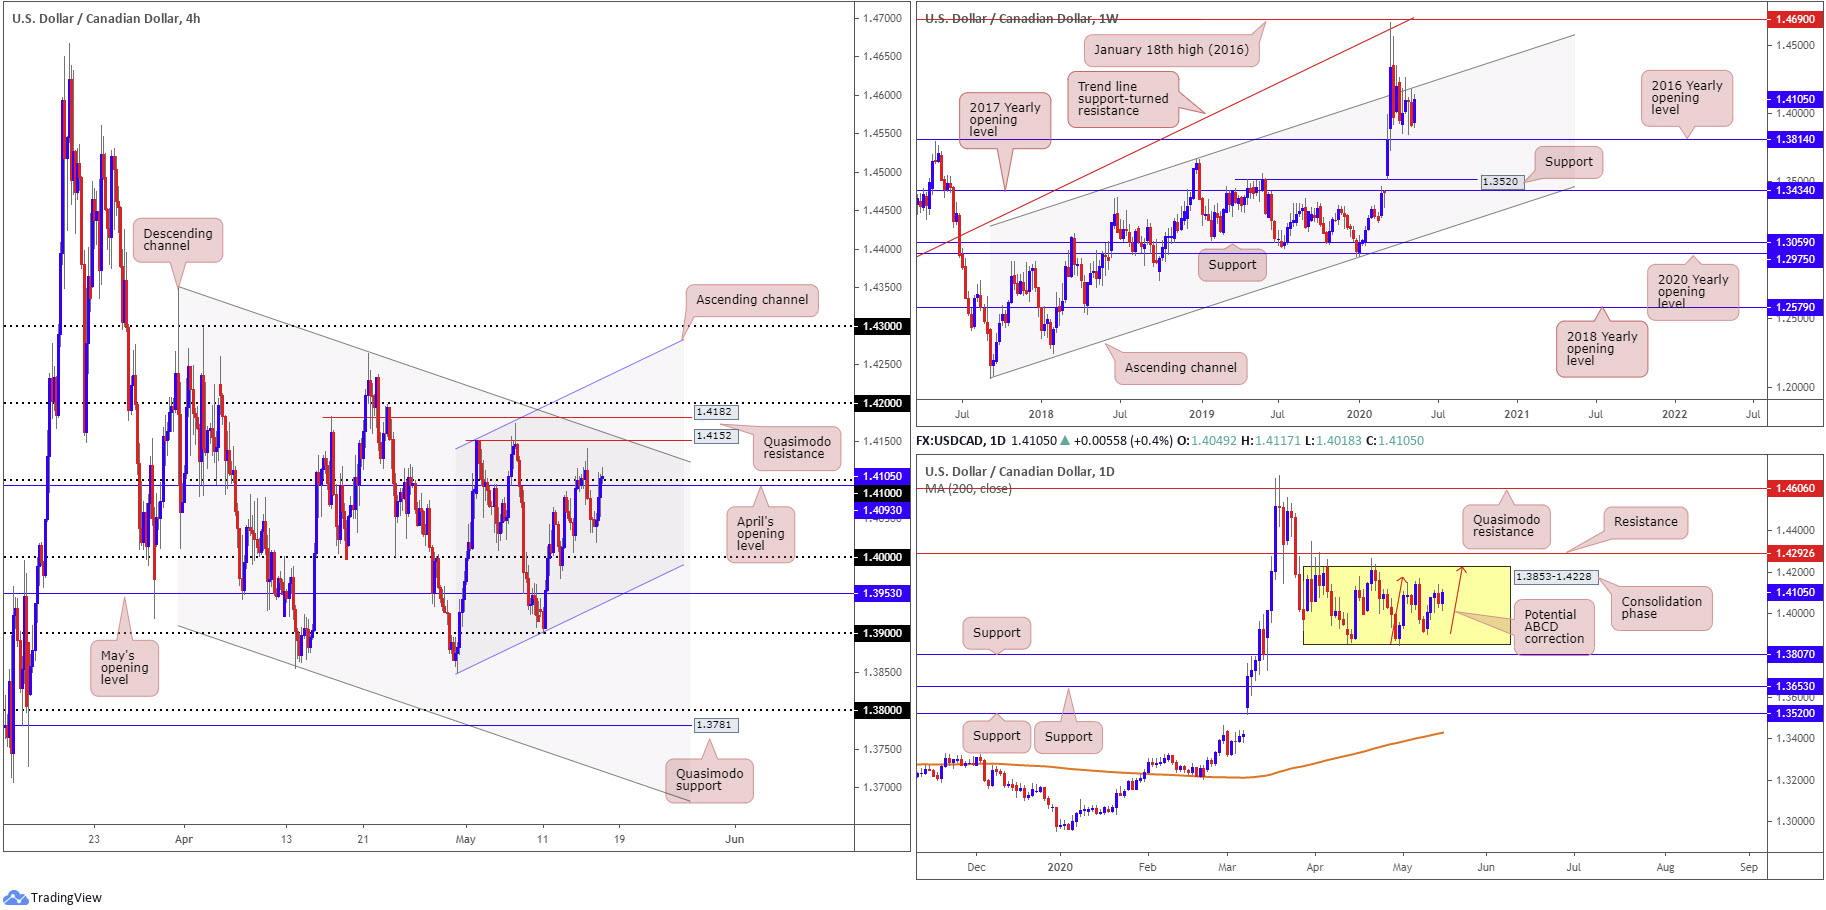
Since late March, buyers and sellers have been squaring off beneath a long-standing channel resistance, taken from the high 1.3661.
Moves lower from this angle may eventually face support off the 2016 yearly opening level at 1.3814. The said base stands in a reasonably healthy position as, overall, we’ve been trending higher since September 2017.
Daily perspective:
Since kicking off April, we have been carving out a consolidation between 1.3853-1.4228. Inside of these walls, traders may also note a possible ABCD approach (red arrows) completing at the top edge of the range.
Areas outside of the base can be found at resistance drawn from 1.4292 and support at 1.3807. In addition, the 200-day SMA (orange – 1.3428), as you can probably see, has been drifting northbound since March.
H4 perspective:
Despite an earlier attempt to overthrow 1.41 and April’s opening level at 1.4093, capped by US retail sales data, price managed to eke out marginal gains above the said figure in the later stages of the session. This consequently draws focus back to H4 Quasimodo resistances seen at 1.4152/1.4182 and channel resistance, etched from the high 1.4349.
The next notable area to have on the watchlist this week is the 1.42 handle, followed by channel resistance, taken from the high 1.4152, whereas beneath 1.41, the key figure 1.40 is seen.
Areas of consideration:
H4 Quasimodo resistances seen at 1.4152/1.4182 as well as H4 channel resistance, etched from the high 1.4349, collectively stands as healthy resistance to watch this week. Conservative traders, however, may seek a H4 close back beneath 1.41 before committing.
Alternatively, traders may wait and see if 1.42 makes a show as this level lines up with the current weekly channel resistance. It’s also worth highlighting that a possible fakeout above 1.42 could be seen to bring in the upper edge of the current daily range at 1.4228.
USD/CHF:
Weekly gain/loss: +0.13%
Weekly close: 0.9713
Weekly perspective:
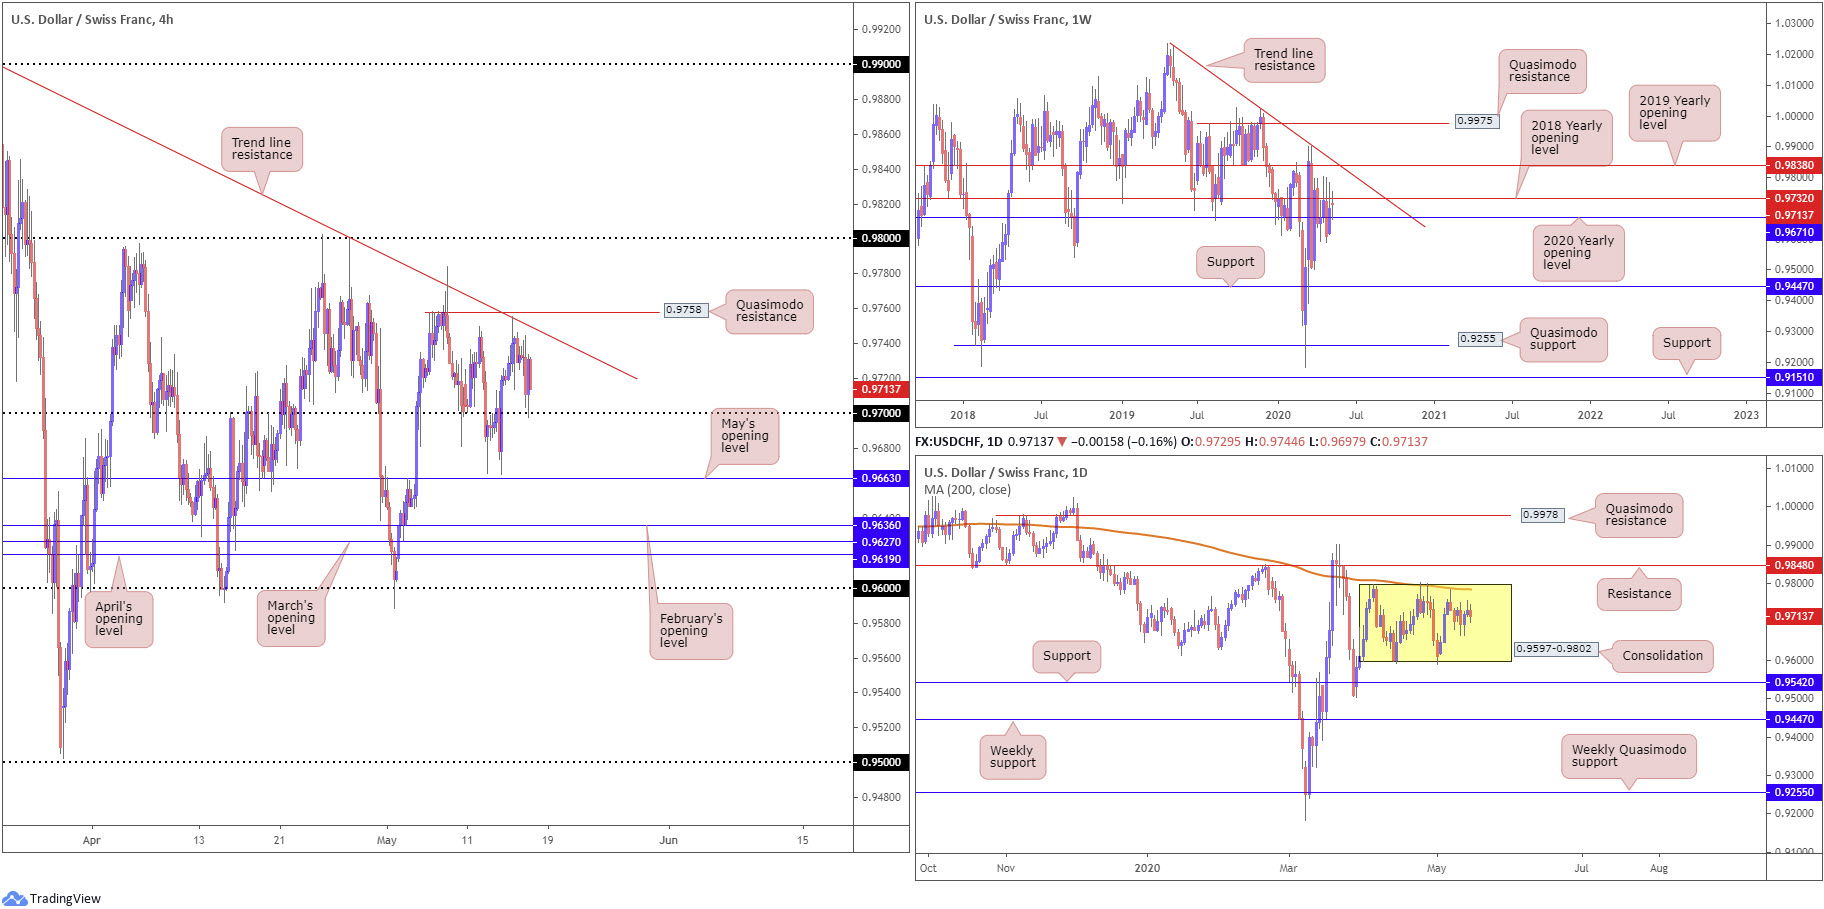
April onwards has witnessed the 2018 yearly opening level at 0.9732 establish resistance, recently motioned in the form of consecutive selling wicks off 0.9800ish. Last week, however, concluded forming a clear-cut indecision candle, with extremes connecting with 0.9732 and the 2020 yearly opening level from 0.9671.
Technical structure above 0.9732 can be seen at the 2019 yearly opening level at 0.9838 and a trend line resistance, taken from the high 1.0226. Moves south of 0.9671 will throw light on the possibility of a run to support at 0.9447.
Daily perspective:
All in all, it was a relatively tame week for USD/CHF on the daily timeframe.
Price action seesawed between gains/losses inside a month-long range between 0.9802/0.9597. Note the 200-day SMA (orange – 0.9784) is seen circling the upper edge of the said range.
Outside of the consolidation, we see resistance at 0.9848 while support can be found at 0.9542.
H4 perspective:
After shaking hands with trend line resistance, etched from the high 0.9900, on Thursday, which happens to also merge closely with a Quasimodo resistance at 0.9758, Friday, aided by US retail sales plunging a record 16.4% in April, tested and held 0.97.
Taking out the aforesaid resistances will shine focus on the 0.98 handle, while trekking sub 0.97 this week has May’s opening level at 0.9663 on the radar.
Areas of consideration:
Having noted weekly price gripping the underside of resistance at 0.9732 (2018 yearly opening level), violating 0.97 this week would not be surprising. Though a push through 0.97 advertises a possible run to May’s opening level at 0.9663 on the H4 timeframe, weekly support at 0.9671, the 2020 yearly opening level, could also hamper downside. Therefore, unless you’re prepared to drill down to the lower timeframes and trade tighter stops, the distance between 0.97 and 0.9671 may be too narrow to consider breakout scenarios.
In case of continued buying, 0.98 could be the next resistance in line, assuming we take over the current H4 trend line resistance and Quasimodo formation at 0.9758. Given 0.98’s connection to the upper edge of the current daily range, 0.98 could serve as not only as a take-profit target for longs above 0.97 and additional intraday long positions above 0.9758, but also as a platform for sellers this week.
Dow Jones Industrial Average:
Weekly gain/loss: -3.05%
Weekly close: 23669
Weekly perspective:
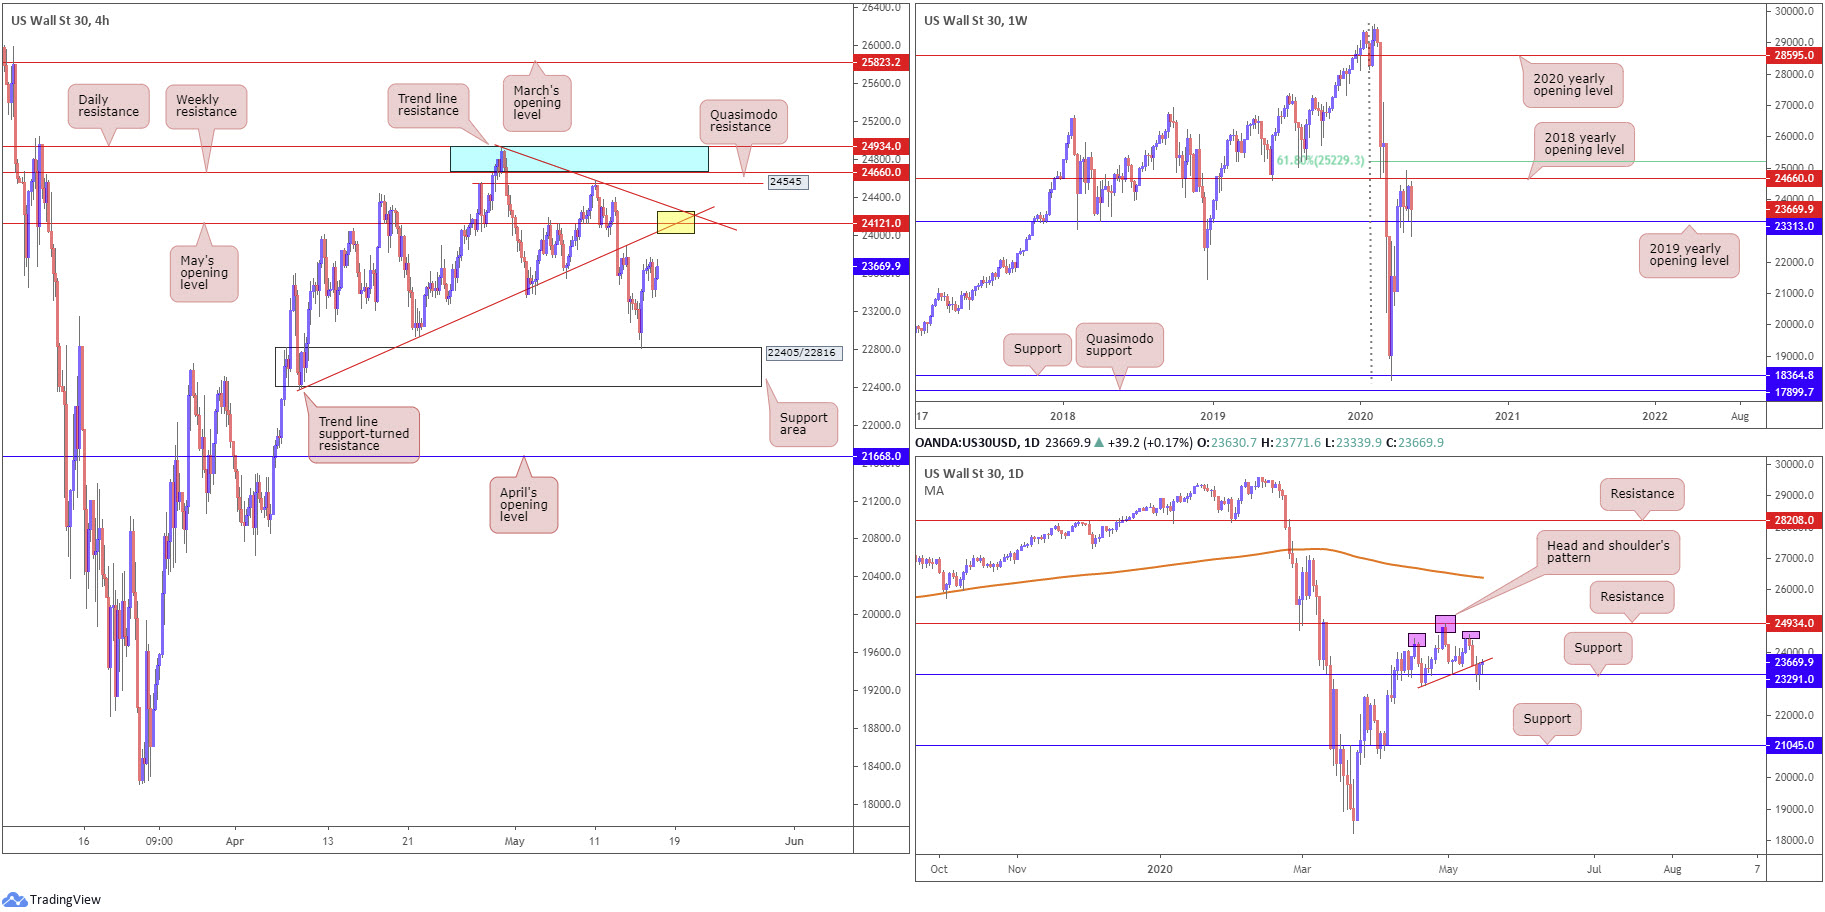
Price welcomed the 2019 yearly opening level at 23313 last week, which, as evident from the weekly chart, held firm.
Since mid-April, price has been sandwiched between 23313 and the 2018 yearly opening level from 24660, closely shadowed by a 61.8% Fibonacci retracement ratio at 25229.
A violation of 23313 shines light on support from 18364, whereas the sky above 25229 is reasonably clear back to the 2020 yearly opening level at 28595.
Daily perspective:
Mid-April onwards has also seen a head and shoulder’s top formation establish off resistance at 24934. Mid-week confirmed the aforesaid pattern, breaking its neckline from 22934 which resulted in price crossing swords with support at 23291.
The aforementioned support remains resilient, recently forcing the unit back to the head and shoulder’s neckline. A push lower from here, a move that dethrones 23291, could see support at 21045 eventually brought into the mix.
H4 perspective:
US stocks nudged higher Friday as recent advances in oil overshadowed unprecedented retail sales data and growing US/China trade pressures. The Dow Jones Industrial Average added 60.08 points, or 0.25%; the S&P 500 firmed by 11.20 points, or 0.39%, and the tech-heavy Nasdaq 100 concluded higher by 58.21 points, or 0.64%.
The support area seen at 22405/22816 came under fire Thursday, forcing a notable recovery, a move that may eventually guide the candles towards a trend line support-turned resistance, taken from the low 22530. Technical traders will also likely acknowledge additional resistance can be seen from a trend line formation from the high 24918, and May’s opening level coming in at 24121 (yellow).
Outside of the above-mentioned resistance structure, Quasimodo resistance is seen at 24545, followed by a familiar resistance area made up of daily resistance at 24934 and weekly resistance (2018 yearly opening level) at 24660.
Areas of consideration:
Weekly price indicates we might be headed for higher ground this week after rebounding from support at 23313.
Daily price, while also seen bouncing from support at 23291, faces the possibility of resistance forming off the head and shoulder’s neckline.
Shorter term, in the event we pop higher this week, the H4 trend line resistances and May’s opening level at 24121 (yellow) may be of interest to sellers.
XAU/USD (GOLD):
Weekly gain/loss: +2.38%
Weekly close: 1741.0
Weekly perspective:
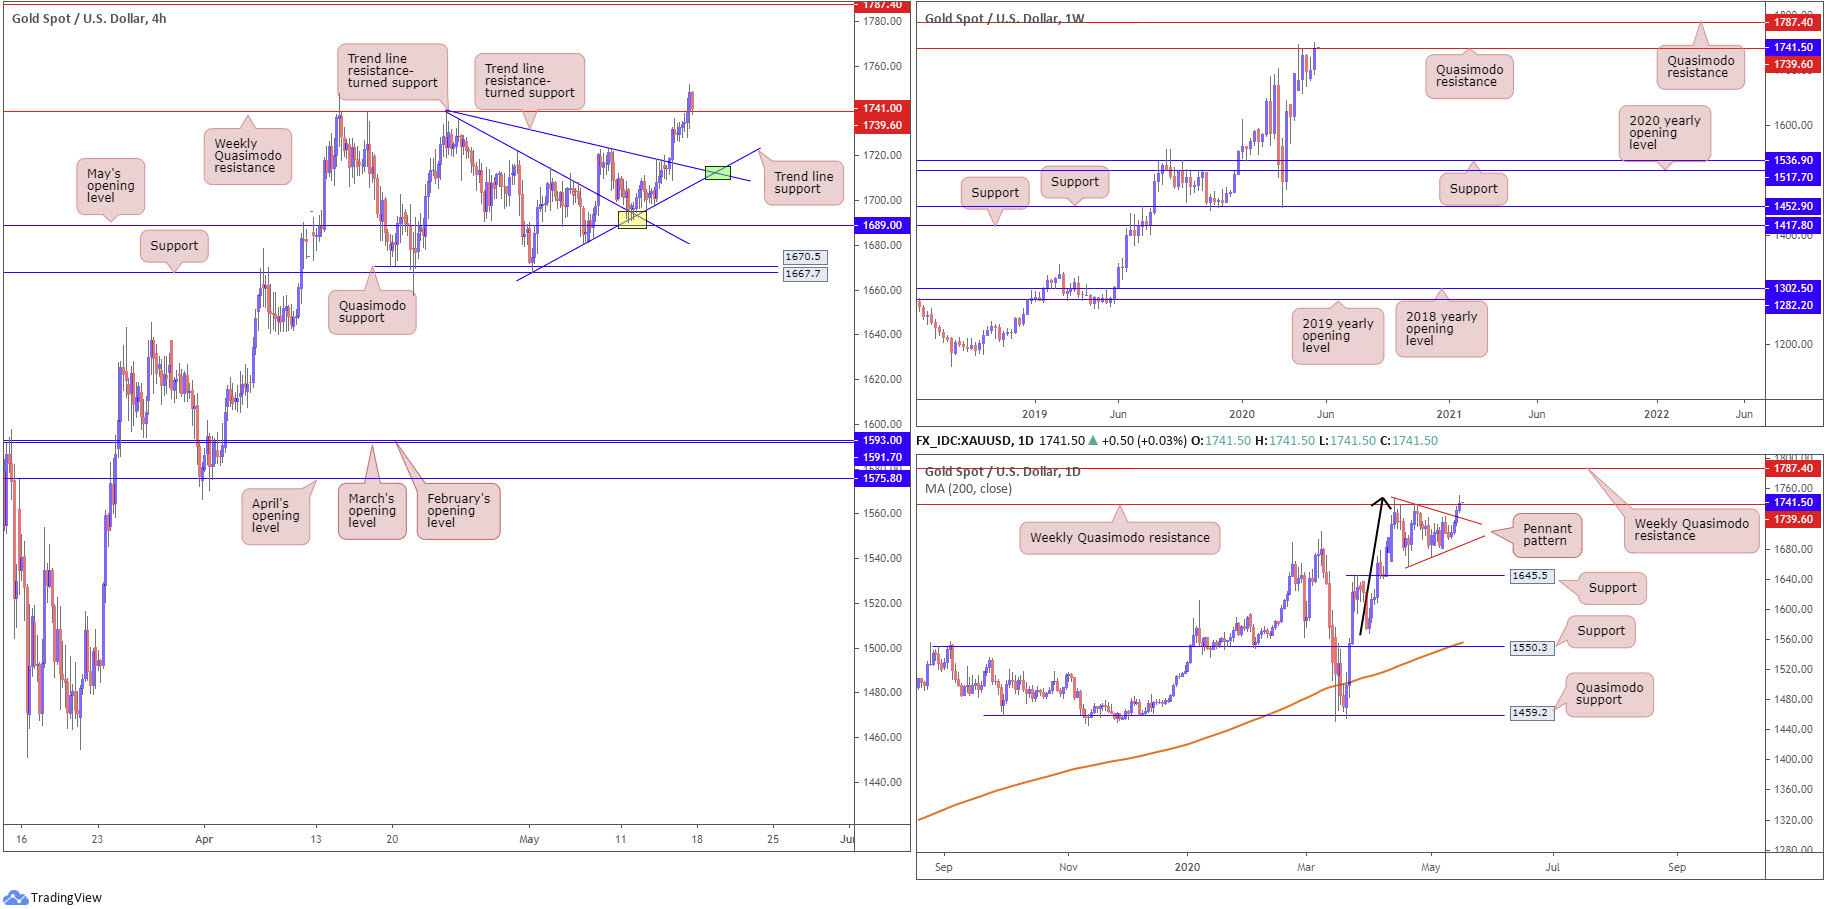
From mid-April, buyers and sellers have been battling for position around the underside of Quasimodo resistance at 1739.6. As evident from the weekly chart, price settled the week a touch above the current Quasimodo resistance, threatening the possibility of a continuation this week to another layer of Quasimodo resistance at 1787.4.
It may also interest some traders to note the trend on gold has faced a northerly trajectory since 2016.
Daily perspective:
Pattern traders, based on the daily timeframe, may note the recently formed pennant pattern, established from a high of 1747.7 and a low of 1658.1, had its upper boundary breached into the later stages of last week. We could, according to this pattern, therefore, be looking at considerable gains in gold over the coming weeks.
What’s also interesting is the aforesaid pattern formed under weekly Quasimodo resistance underlined above at 1739.6.
H4 perspective:
As covered in previous analysis, price action recently shook hands with two merging trend line supports (1739.1/1668.0), plotted just north of May’s opening level at 1689.0 (yellow). Sustained buying saw the 1723.5 May 8 high engulfed, with Friday’s follow-through move swamping weekly Quasimodo resistance at 1739.6. Friday’s move also marked the yellow metal’s fourth consecutive daily gain.
The two merging H4 trend line supports were noted levels to keep an eye on in recent writing – well done to any readers who managed to catch this move.
Areas of consideration:
With H4 price marginally closing above weekly Quasimodo resistance at 1739.6, breakout buyers may be looking for the said base to hold as support in early trade for a continuation to 1787.4.
A H4 bullish candlestick printed off 1739.6 would likely appeal – traders may consider this a sign of buyer intent.
Failure to hold off 1739.6 could see an intraday dip to H4 trend line support, taken from the low 1668.0, and a merging trend line resistance-turned support, from the high 1739.1 (green).
The accuracy, completeness and timeliness of the information contained on this site cannot be guaranteed. IC Markets does not warranty, guarantee or make any representations, or assume any liability regarding financial results based on the use of the information in the site.
News, views, opinions, recommendations and other information obtained from sources outside of www.icmarkets.com.au, used in this site are believed to be reliable, but we cannot guarantee their accuracy or completeness. All such information is subject to change at any time without notice. IC Markets assumes no responsibility for the content of any linked site.
The fact that such links may exist does not indicate approval or endorsement of any material contained on any linked site. IC Markets is not liable for any harm caused by the transmission, through accessing the services or information on this site, of a computer virus, or other computer code or programming device that might be used to access, delete, damage, disable, disrupt or otherwise impede in any manner, the operation of the site or of any user’s software, hardware, data or property.