


Key risk events today:
German Import Prices m/m; US Advance GDP q/q; US Advance GDP Price Index q/q.
EUR/USD:
As forecast by consensus, European Central Bank (ECB) policymakers opted to stand pat on rates Thursday and therefore refrained from lowering the deposit rate. However, tweaking its forward guidance on rates to include an ‘or lower’ option, the central bank prepared markets for more easing measures.
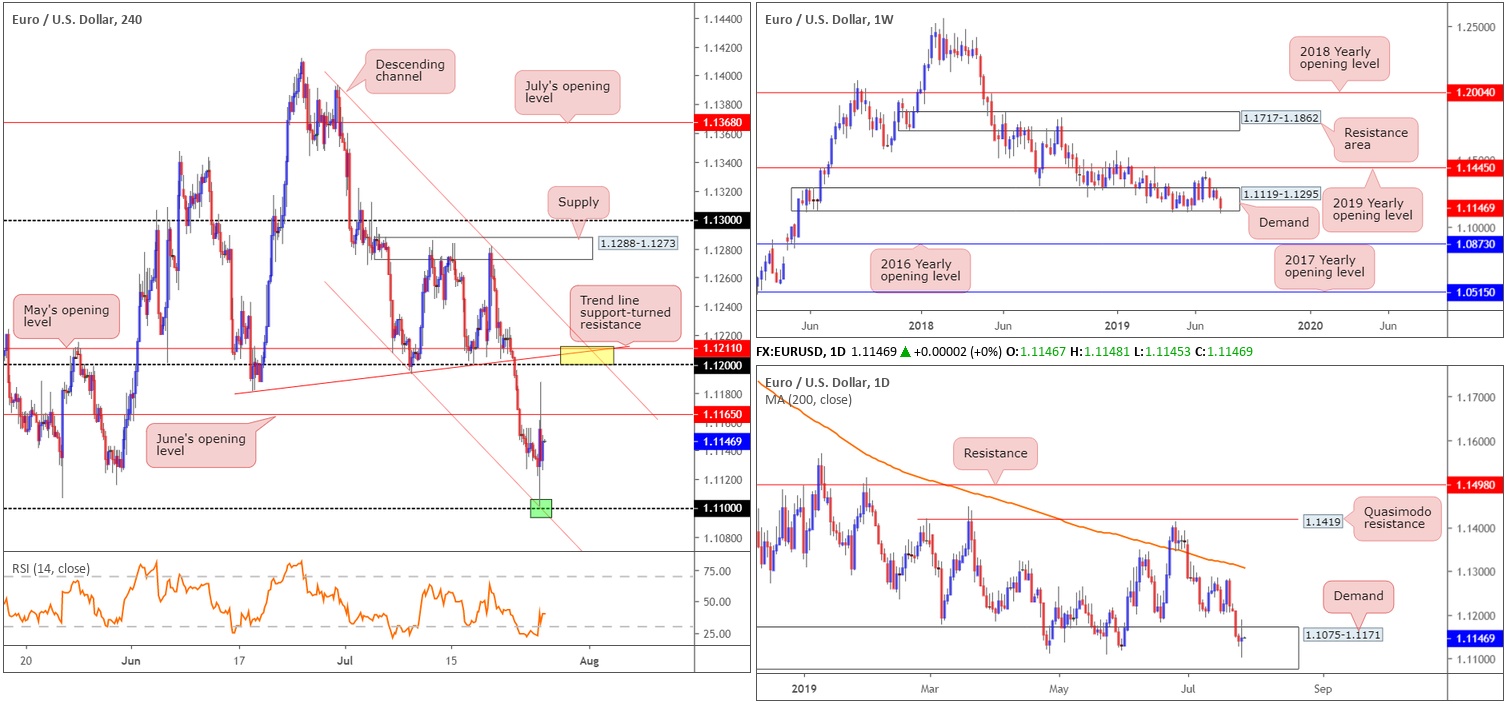
In the heat of the ECB’s latest movement, the EUR/USD triggered fresh 2019 lows at 1.1101 and recovered to a session high of 1.1187, consequently slicing through June’s opening level (resistance) at 1.1165 on the H4 timeframe. It was Draghi’s press conference that triggered the recovery alongside technical buyers off the H4 channel support (taken from the low 1.1232) that’s positioned a point north of the 1.11 handle (green area).
Technically, traders’ crosshairs are still likely fixed on June’s opening level at 1.1165 as the next port of resistance, while to the downside we also still have the 1.11 handle that aligns with channel support (green) taken from the low 1.1232 in sight. In addition to 1.1165, traders may also want to acknowledge the zone marked in yellow between May’s opening level at 1.1211 and the 1.12 handle, which also intersects with a trend line support-turned resistance (extended from the low 1.1181) and a channel resistance (taken from the high 1.1392).
On more of a broader perspective, long-standing weekly demand at 1.1119-1.1295 recently had the lower edge of its base clipped, though this was unlikely enough to trigger major stops. The next support target can be seen around the 2016 yearly opening level at 1.0873. A closer reading of price action on the daily timeframe, nonetheless, reveals the unit is treading water within the walls of demand at 1.1075-1.1171 in the shape of a clear-cut indecision candle (glued to the underside of the current weekly demand area).
Areas of consideration:
Despite recent volatility, the research team’s outlook remains unchanged:
The zone marked in yellow between May’s opening level at 1.1211 and the 1.12 handle, which also intersects with a trend line support-turned resistance (extended from the low 1.1181) and a channel resistance (taken from the high 1.1392) is STILL of interest for potential selling opportunities on the H4 timeframe. However, before reaching the said zone, June’s opening level at 1.1165 may serve as resistance and force price action towards the 1.11 neighbourhood. For that reason, should the H4 candles chalk up a notable bearish candlestick configuration at 1.1165 today, a short from here is also a consideration (entry/risk can be determined according to the candlestick’s structure).
In terms of long opportunities, the research team aired an interest at the point (green) which 1.11 converges with channel support (etched from the low 1.1207) on the H4. Well done to any of our readers who managed to jump aboard this to-the-point move yesterday. Although it involved trading during news time, the risk/reward here was incredible. In the event we test the 1.11 handle today, given it’s positioned within the current daily demand, a long could be of interest to some traders here. Conservative traders may opt to wait and see if a bullish candlestick formation develops before pulling the trigger, helping to avoid a fakeout that’s frequently seen around psychological numbers.
GBP/USD:
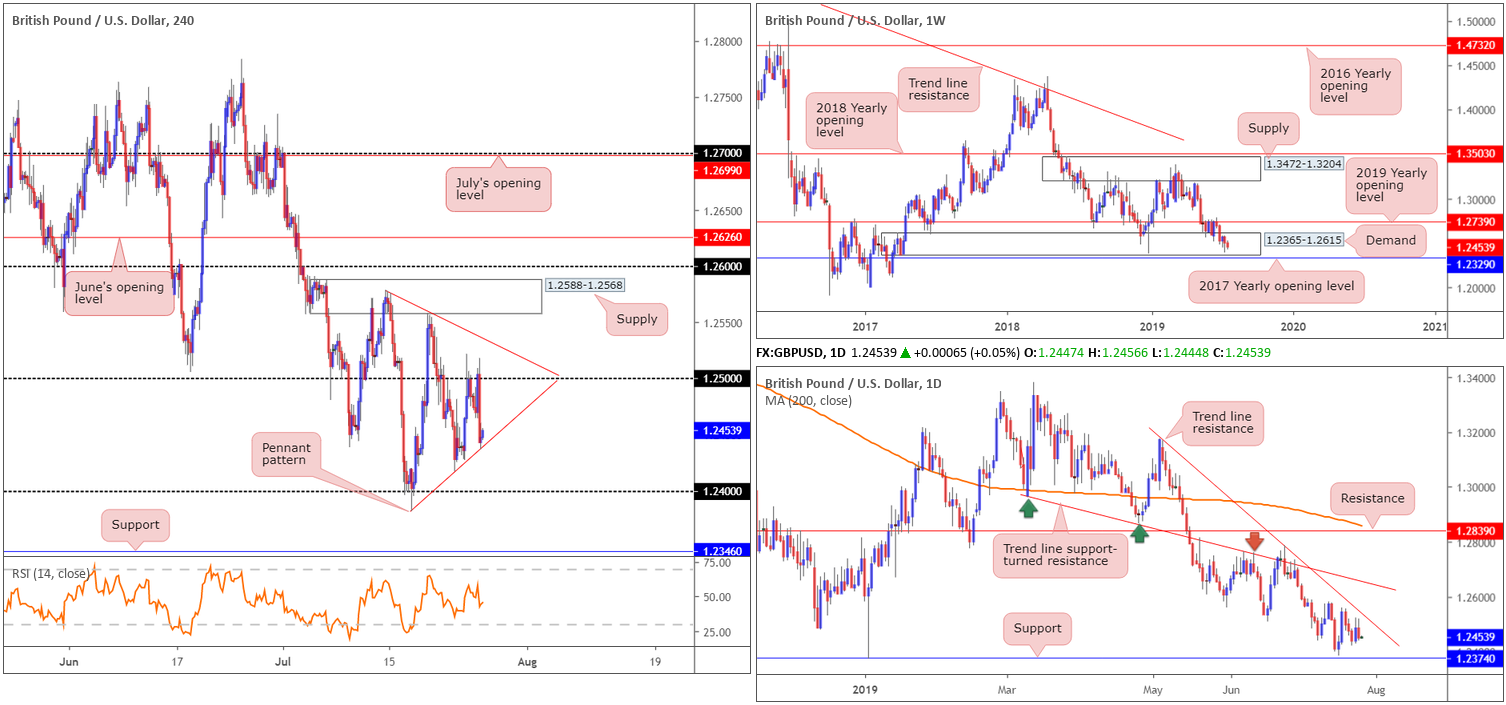
Since mid-July, the H4 candles have been compressing within what appears to be a pennant formation. Of late, however, air was thin above 1.25 and swiftly retreated to 1.2442 into the close. The move was largely influenced on the back of a stronger dollar, bolstered by better-than-expected US data, which reaffirmed expectations the Fed is unlikely to deliver a 50 bps rate cut at its upcoming meeting.
Areas outside of the current H4 pennant to be aware of are the H4 supply plotted overhead at 1.2588-1.2568 and the 1.24 handle. The supply area has not only proven itself a worthy contender in terms of resistance throughout the month, it also coincides with a daily trend line resistance (extended from the high 1.3176). In addition to this, focus also remains on the 1.24 handle owing to it holding price action higher last week.
Taken from Thursday’s report:
The weekly timeframe shows long-standing demand at 1.2365-1.2615 remains in the fold, though is struggling to chalk up anything meaningful to the upside. Traders, therefore, may want to note the 2017 yearly opening level at 1.2329 as the next possible support.
Areas of consideration:
Unless traders are brave enough to trade within the limits of the aforementioned H4 pennant pattern, there’s two areas of interest, according to the technical studies presented here:
- H4 supply around 1.2588-1.2568, which boasts higher-timeframe confluence, is ideal for shorting opportunities.
- 24 is also likely of interest to some traders having seen the level align closely with daily support at 1.2374 (the next downside target on the daily timeframe).
Both zones are liable to a fakeout, therefore, traders are urged to wait for additional candlestick confirmation before entering a position (entry/risk levels can be determined according to the candlestick’s structure).
AUD/USD:
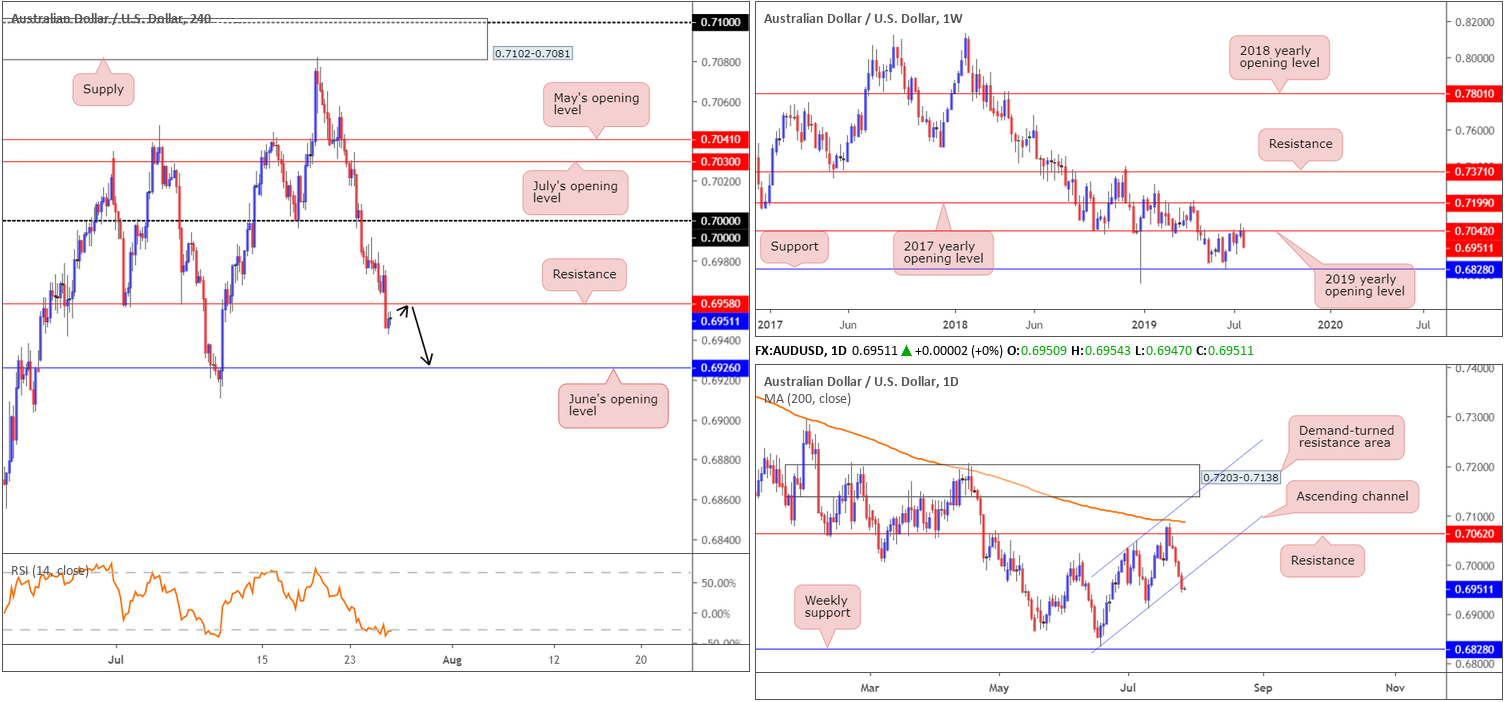
The Australian dollar remained on the defensive vs. the US dollar Thursday, consequently registering its fifth consecutive daily decline since topping at 0.7082. Technical selling emerged in early trade as price action engulfed the key figure 0.70. Dovish comments from RBA Governor Lowe saw further downside materialise, though it wasn’t until US trade did the market witness the H4 candles overthrow support at 0.6958 (now serving as resistance), bolstered on the back of upbeat US data. This potentially cleared the path lower for a run towards June’s opening level at 0.6926.
Against the backdrop of H4 flow, higher-timeframe action exhibits scope to explore lower ground. As highlighted in previous reports, Weekly activity crossed paths with the 2019 yearly opening level (resistance) at 0.7042. Having seen this base serve well as support on several occasions in the past and hold price action lower early July, active selling from here is not a surprise. The next downside support target can be seen at 0.6828.
In conjunction with weekly structure, daily movement crossed beneath channel support (extended from the low 0.6831) yesterday in the shape of a near-full-bodied bearish candle. Aside from the possibility of support developing from the 0.6910 July 10 low, limited support is visible until shaking hands with weekly support underscored above at 0.6828.
Areas of consideration:
Having observed all three timeframes display signs further selling may be upon us, a retest of H4 resistance at 0.6958 could be something to watch for today for possible selling opportunities. A H4 bearish (Japanese) candlestick pattern formed off 0.6958, coupled with the higher timeframes pointing in a southerly bearing, is considered a high-probability setup, with an initial take-profit target set at 0.6926.
USD/JPY:
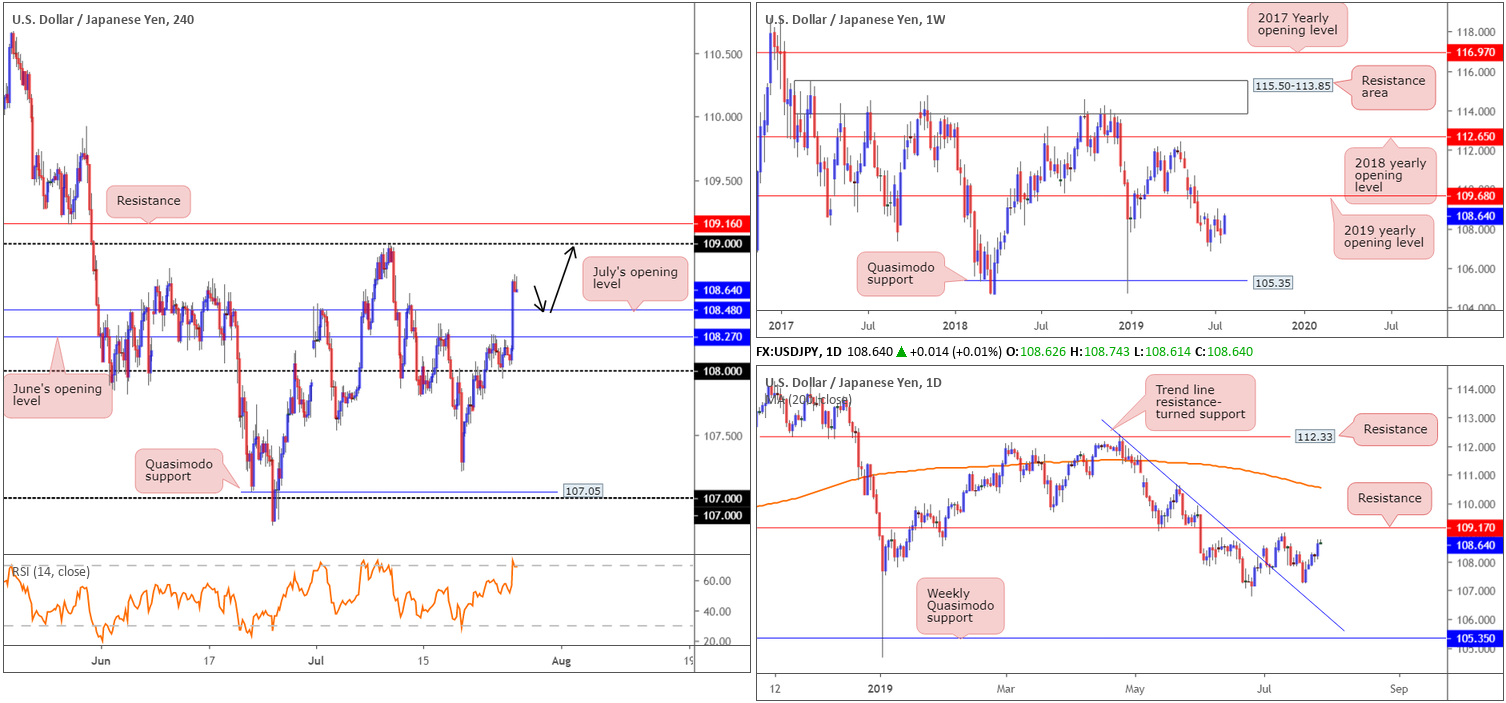
Strengthened as a result of rising US Treasury bond yields and broad USD bidding, the USD/JPY touched gloves with 15-day highs near 108.75 Thursday. Recent movement witnessed the pair dethrone June’s opening level at 108.27 as well as July’s opening level at 108.48, perhaps unbolting the door for a move towards the 109 handle, closely shadowed by resistance at 109.16 on the H4 timeframe.
In terms of higher-timeframe flow, Thursday’s outlook remains in force:
Daily action reveals its next upside target sets around 109.17, a point higher than H4 resistance highlighted above. To the downside, the 106.78 June 25 low may offer support, closely followed by trend line resistance-turned support (extended from the high 112.40) and then the weekly Quasimodo support at 105.35.
Areas of consideration:
Taken from Wednesday’s analysis:
Higher-timeframe structure on the USD/JPY displays room to explore higher ground. On account of this, long opportunities exist above 108.48 on the H4, targeting 109/109.16. A retest of 108.48 as support is likely welcomed confirmation as per the black arrows (entry and risk can be determined according to the rejecting candlestick’s structure).
Upon connecting with 109, traders are urged to close any long positions and consider selling. The round number, coupled with H4 resistance at 109.16 and daily resistance at 109.17, provides a strong ceiling in which to short. Traders concerned by the possibility of a fakeout materialising through 109 have the option of waiting and seeing if a H4 bearish candlestick develops before initiating a position. This way, seller intent is visible and entry and risk levels are structured.
USD/CAD:
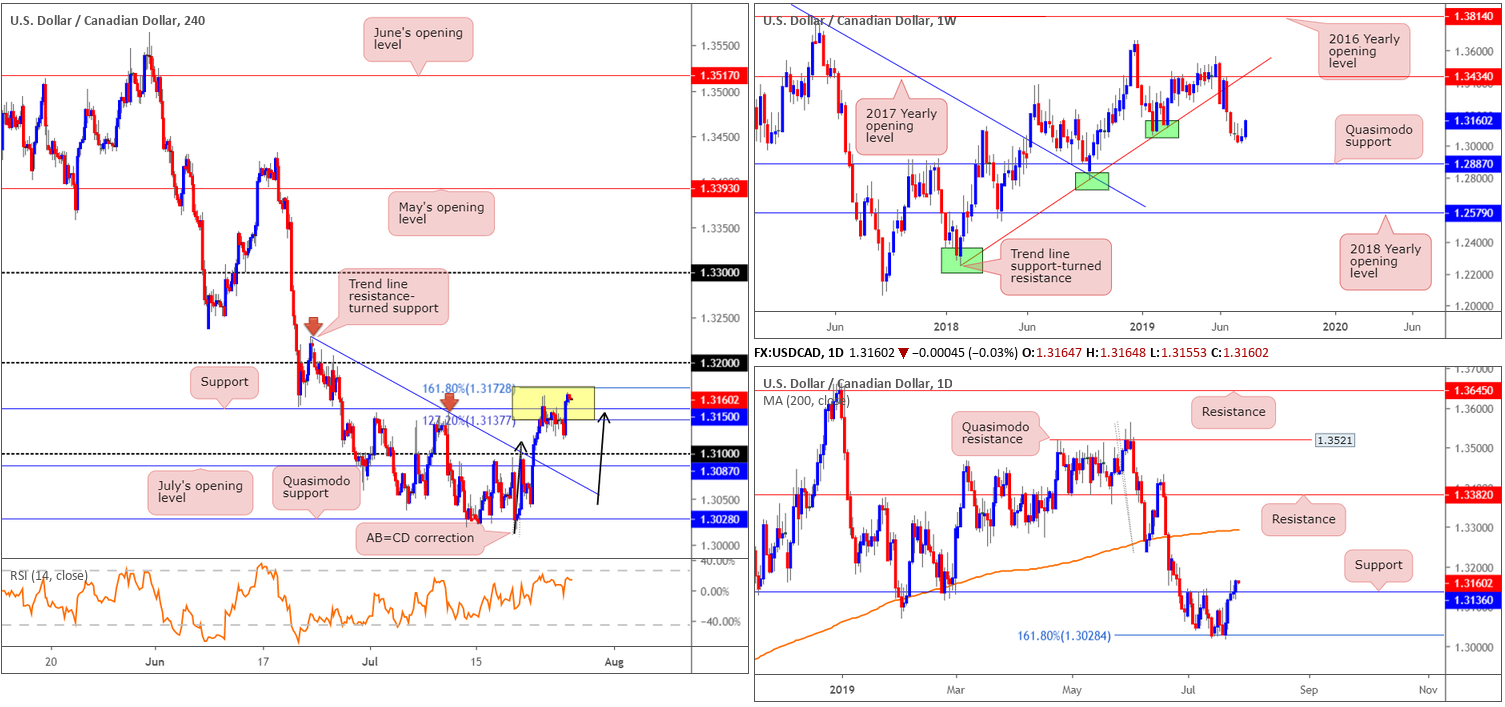
For those who read previous reports you may recall the research team highlighted 1.3172/1.3137 as a potential sell zone (yellow). Formed by way of a H4 AB=CD approach, a H4 resistance at 1.3150, daily resistance at 1.3136 and the H4 RSI nearing its overbought value, this area remains in the fold, though appears fragile.
Both H4 resistance and daily resistance are now support levels, owing to recent buying. Assuming the said levels hold, its likely we’re heading towards the 1.32 handle. Beyond here, traders’ crosshairs are likely fixed on the 200-day SMA (orange at 1.3296) as the next upside target, closely trailed by the 1.33 handle.
As for weekly action, the current candle emphasises a strong bullish tone, though according to the technical studies lacks support. The next visible floor on this timeframe can be seen at a Quasimodo support drawn from 1.2887. Despite this, continued buying on this scale has the 2017 yearly opening level at 1.3434 to target.
Areas of consideration:
While there are clearly signs the H4 AB=CD reversal zone at 1.3172/1.3137, despite local and higher-timeframe confluence, is struggling to cap price, the area is still in play. Should the H4 candles retest the area between support at 1.3150 and daily support at 1.3136 and hold firm in the form of a strong bullish candle, it might be worth closing any shorts and opening a long position, targeting 1.32 as the initial take-profit target (entry and risk levels can be determined according to its structure).
USD/CHF:
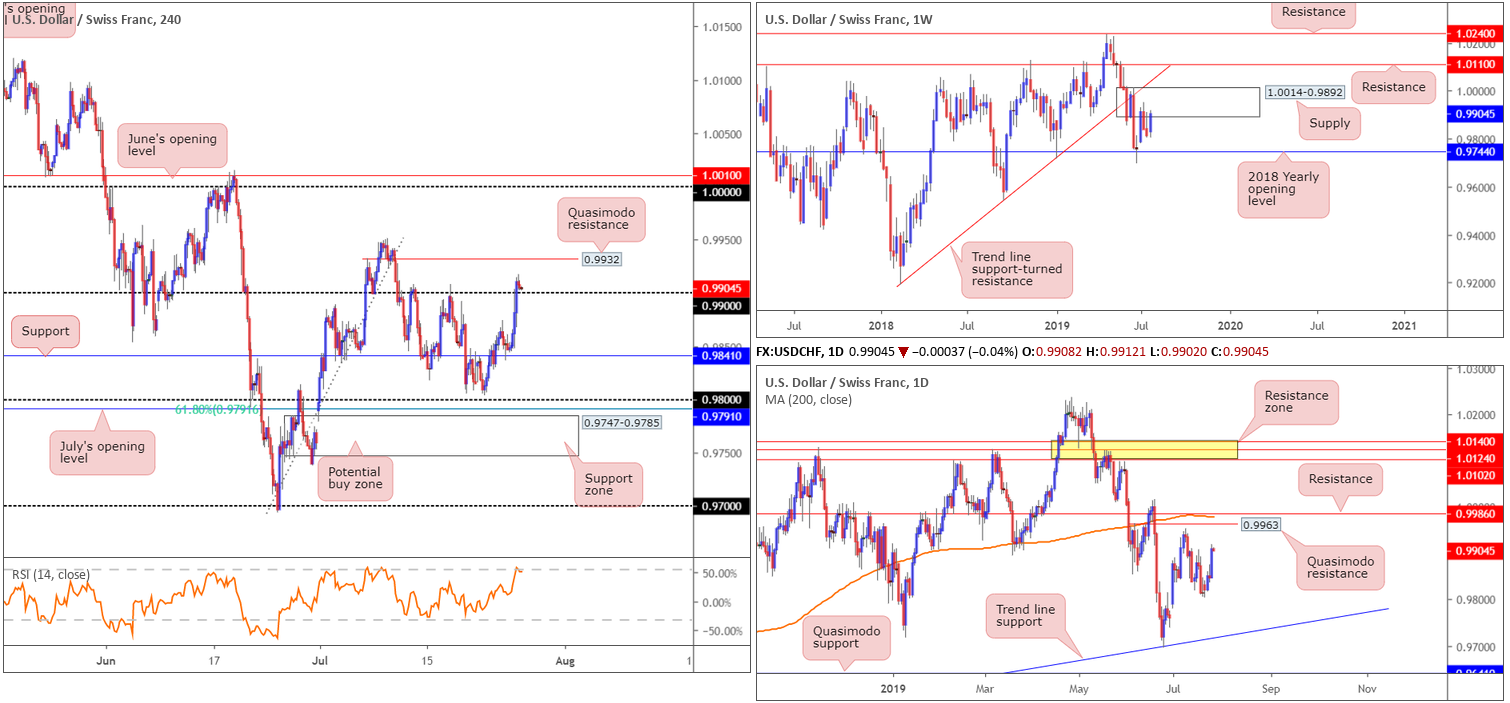
Demand for the safe-haven Swiss franc diminished Thursday, following European Central Bank (ECB) policymakers opting to stand pat on rates. The US dollar added 0.63% vs. the Swissie, throwing the H4 candles beyond 0.99 to highs of 0.9918. As we transition into Asia Pac trade, the possibility of a retest forming at 0.99 is certainly there, with the next upside target coming in at 0.9932: a Quasimodo resistance. Above this structure, the research team notes room to press as far north as 1.0000 (parity), closely shadowed by June’s opening level at 1.0010.
As for the higher timeframes, weekly price recently engaged with the underside of supply at 1.0014-0.9892. Given the limited response seen from this area thus far, traders may also find use in noting the trend line support-turned resistance (extended from the low 0.9187), closely followed by resistance at 1.0110. Closer examination of price action on the daily timeframe shows the unit pressing north to Quasimodo resistance at 0.9963, closely followed by resistance at 0.9986 and the 200-day SMA (orange).
Areas of consideration:
A retest, preferably formed by way of a H4 or H1 bullish candlestick configuration, at 0.99 on the H4 timeframe is in focus this morning. Entry and risk can be determined according to the candlestick’s rules of engagement, targeting Quasimodo resistance at 0.9932 as the initial take-profit zone, followed by daily Quasimodo resistance at 0.9963.
Dow Jones Industrial Average:
US equities fell Thursday amid concern the Federal Reserve will not be as dovish as expected in its monetary policy announcement next week following strong economic data and remarks from the top European Central Bank official. The Dow Jones Industrial Average declined 0.47%; the S&P 500 erased 0.53% and the tech-heavy Nasdaq 100 also erased 1.01%.
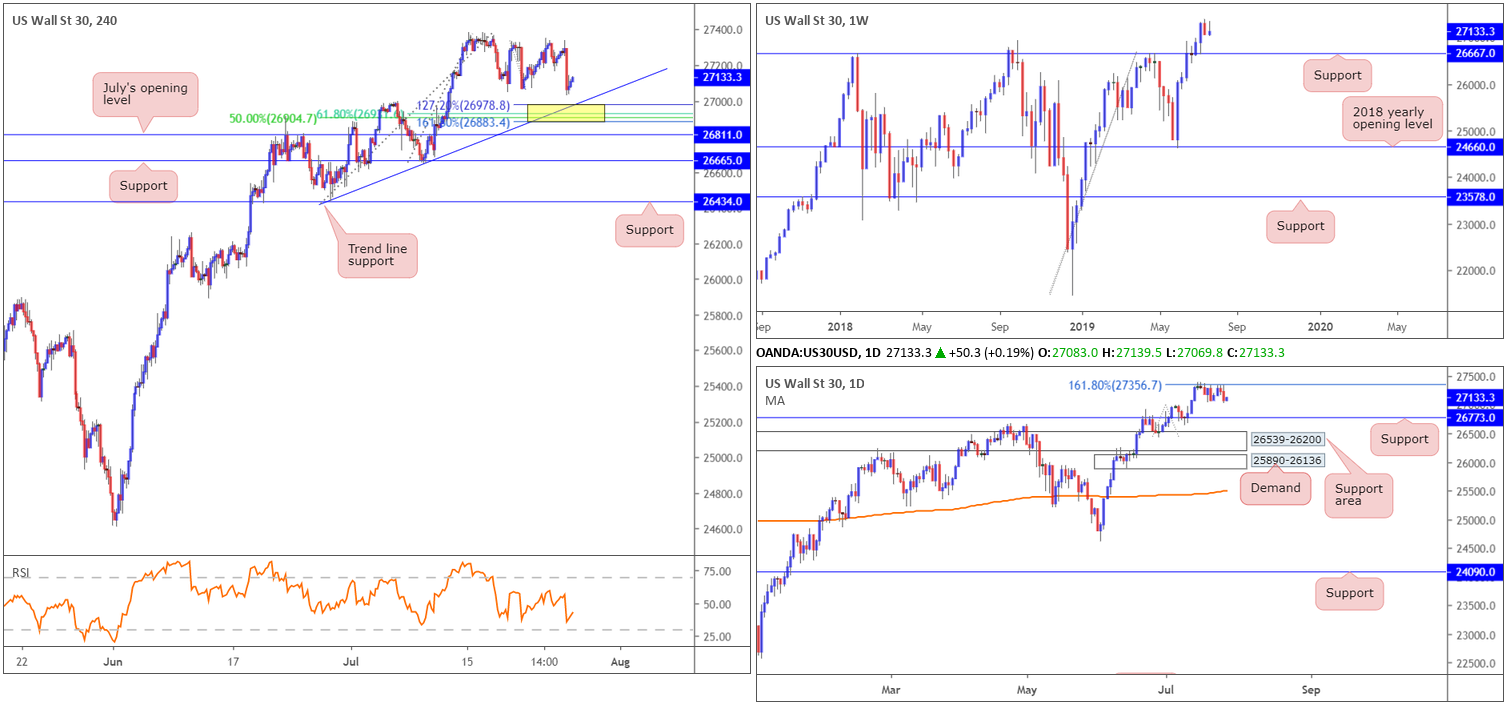
From a technical standpoint on the H4 timeframe, also voiced within previous reports, the yellow area marked between the 161.8% and 127.2% Fibonacci ext. points at 26883/26978 is still an option for longs in the event price action dips lower. Note this area merges with a trend line support (taken from the low 26436), a 61.8% Fibonacci retracement at 26930 and a 50.0% support value at 26904.
Recent reports also aired the following regarding the higher timeframes:
While weekly price displays room to extend gains to 28070 (not visible on the screen), a 127.2% Fibonacci ext. point taken from the low 21425, daily movement is defending the underside of 27356: the 161.8% Fibonacci ext. point. Continued selling from here has a downside support target set at 26773, located just north of weekly support at 26667.
Areas of consideration:
In view of the above, the research team’s outlook remains unchanged as we head into Friday’s sessions:
Should the index shake hands with H4 trend line support and merging Fibonacci levels (see above), a long could be considered, with a stop-loss order fixed beneath 26883. The first take-profit target from this point will depend on the approach, but overall the research team have 27356 on the daily timeframe in sight.
If the unit continues pushing for record highs and engulfs daily resistance at 27356, a long on the retest of this barrier is also an option, targeting the weekly resistance level underlined above at 28070.
XAU/USD (GOLD):
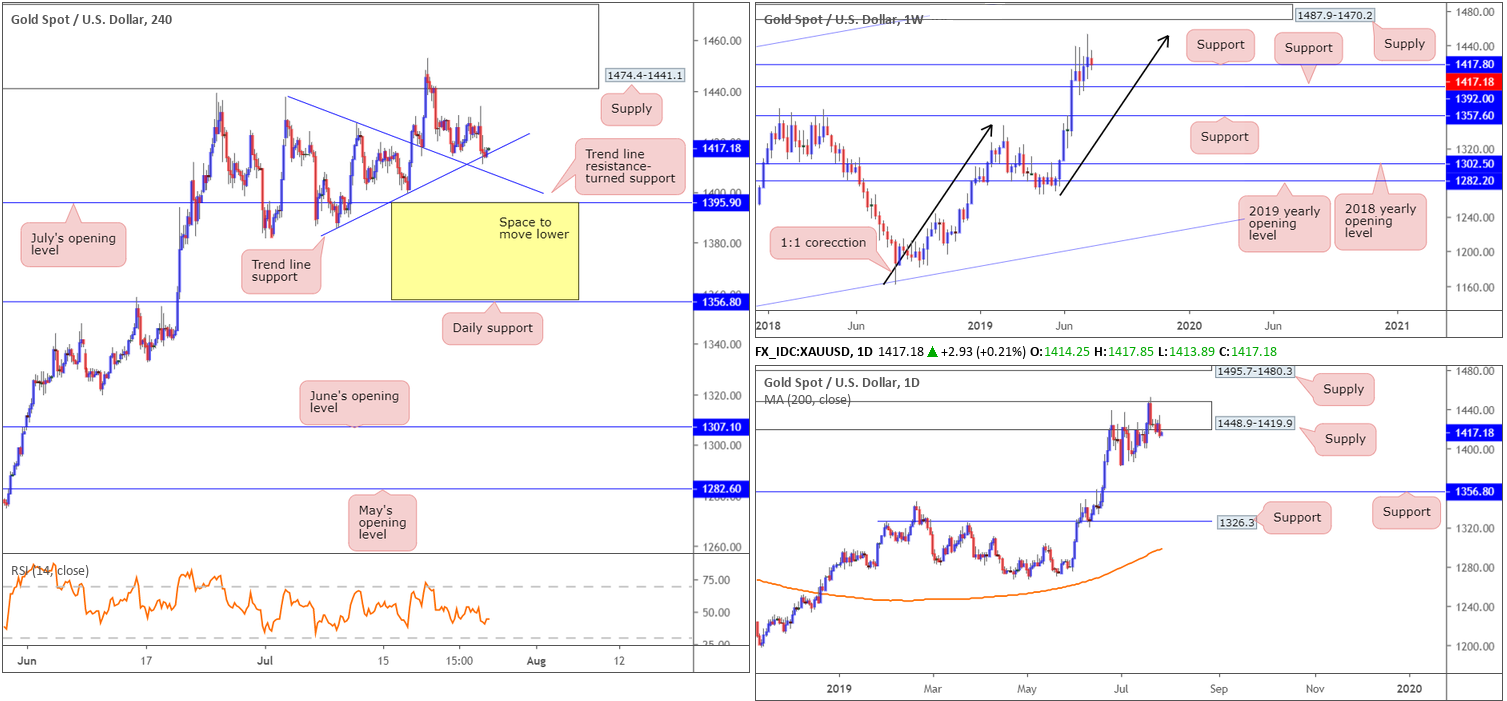
In recent sessions, we’ve seen bullion test H4 trend line support (taken from the low 1385.5), which, as you can see, is sited just north of another layer of trend line support (prior resistance) taken from the high 1437.7 and July’s opening level at 1395.0.
Supporting the current trend line support is weekly support coming in at 1417.8, brought into the mix after weekly price responded to a 1:1 correction (black arrows) around 1453.2 shaped from the 1160.3 August 13 low last week. Therefore, the current H4 trend line support is a potential buy zone going into today’s session, with H4 supply printed at 1474.4-1441.1 sited as the first take-profit target.
The technical landscape on the daily timeframe, also aired within Monday’s weekly report, observed a break of the top edge of a supply zone at 1448.9-1419.9 late last week. While this move was likely enough to trip a portion of the stop-loss orders above here, it’s unlikely to have cleared the path north to supply at 1495.7-1480.3. As for downside targets on this scale, the research team notes to be aware of the 1381.9 July 1 low, followed by support at 1356.8.
Areas of consideration:
With the above in mind, traders have the option of buying this market at current price, targeting H4 supply at 1474.4-1441.1 as the initial port of call. In recent movement, we had a near-full-bodied H4 bullish candle develop, which could be enough to prompt buying today. Entry and stop-loss levels can be positioned according to the structure of the said candle rejection.
The accuracy, completeness and timeliness of the information contained on this site cannot be guaranteed. IC Markets does not warranty, guarantee or make any representations, or assume any liability regarding financial results based on the use of the information in the site.
News, views, opinions, recommendations and other information obtained from sources outside of www.icmarkets.com.au, used in this site are believed to be reliable, but we cannot guarantee their accuracy or completeness. All such information is subject to change at any time without notice. IC Markets assumes no responsibility for the content of any linked site.
The fact that such links may exist does not indicate approval or endorsement of any material contained on any linked site. IC Markets is not liable for any harm caused by the transmission, through accessing the services or information on this site, of a computer virus, or other computer code or programming device that might be used to access, delete, damage, disable, disrupt or otherwise impede in any manner, the operation of the site or of any user’s software, hardware, data or property.