


Key risk events today:
China Fixed Asset Investment ytd/y and Industrial Production y/y; German Prelim GDP q/q; US Core Retail Sales m/m and Retail Sales m/m; US Prelim UoM Consumer Sentiment.
(Previous analysis as well as outside sources – italics).
EUR/USD:
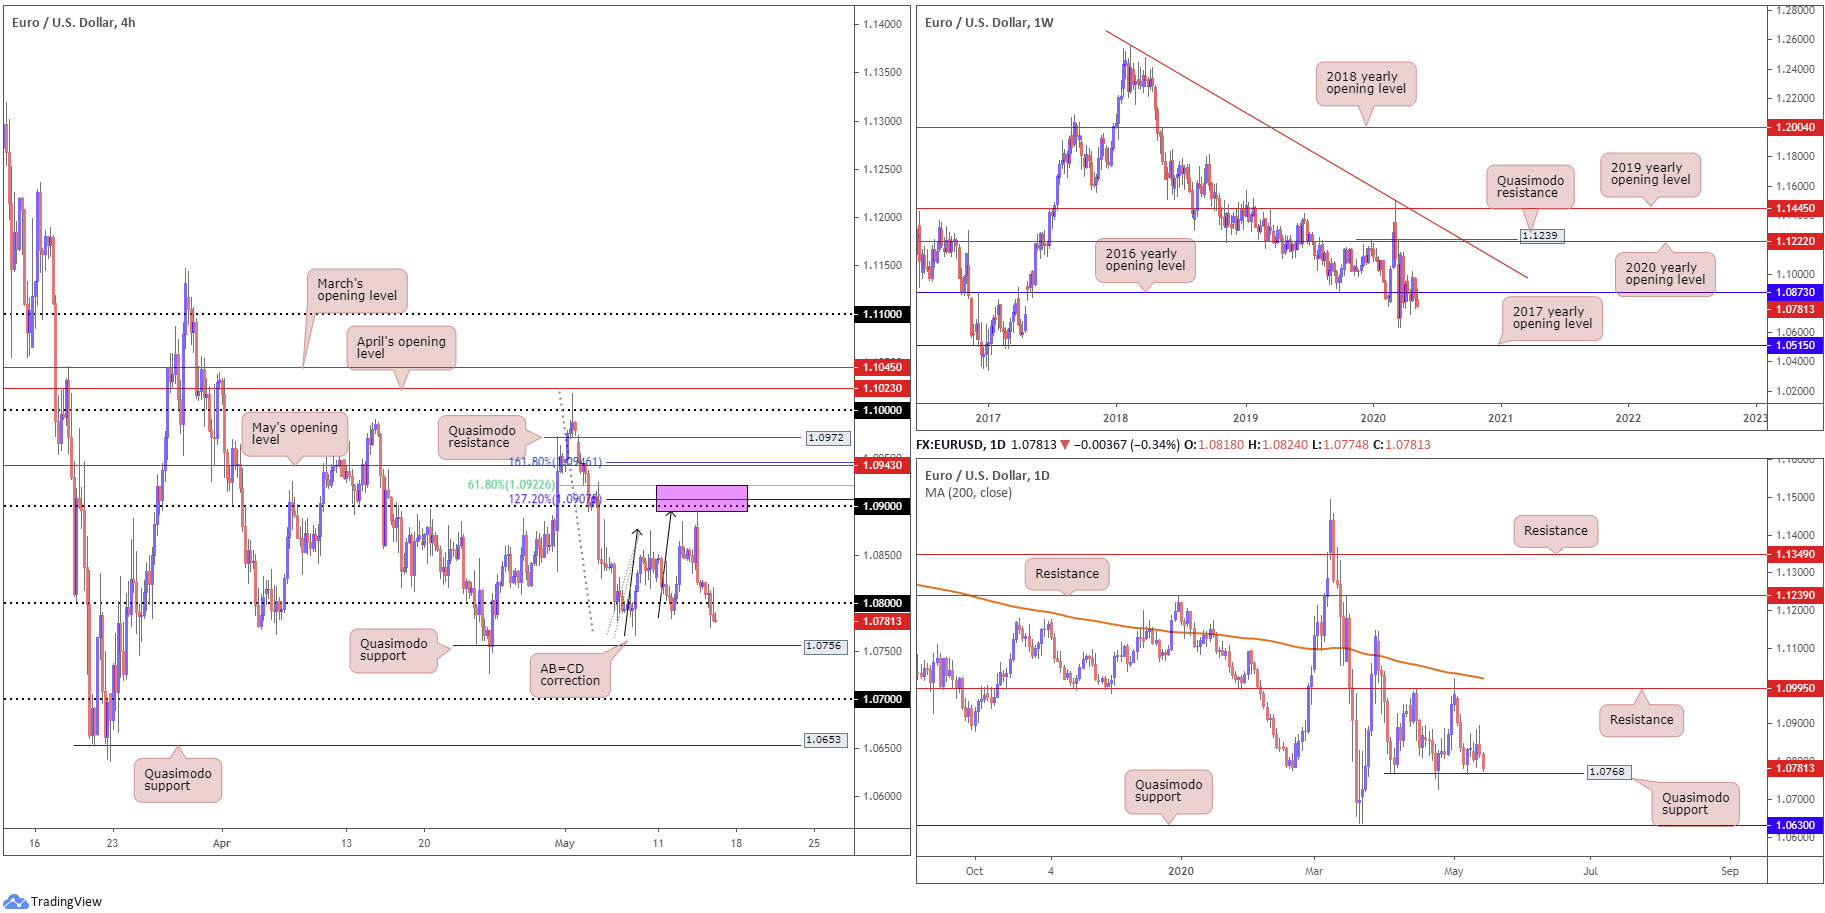
Thursday’s fleeting recovery attempt north of 1.08 fell flat as broad-based USD upside capped gains. This follows Wednesday’s decisive sell-off from 1.09ish. The round number joined closely with a potential AB=CD correction (black arrows) at 1.0895, a 127.2% Fibonacci extension point coming in from 1.0907 and a 61.8% Fibonacci retracement ratio at 1.0922 (pink).
EUR/USD concluded Thursday under 1.08, with technicians staring at the possibility of a move to Quasimodo support at 1.0756, and quite possibly 1.07.
Further afield on the weekly timeframe, weekly price remains languishing beneath its 2016 yearly opening level at 1.0873. Overall, the pair has been involved in a long-term downtrend since topping in early 2018. A nudge lower could see multi-year lows enter sight at 1.0635, while firming may eventually witness the 2020 yearly opening level at 1.1222 make a play.
Price movement on the daily timeframe jolted to within touching distance of Quasimodo support from 1.0768 yesterday. Last Thursday’s reaction off this figure produced little, therefore traders are likely preparing for the possibility of moves south of this angle, potentially shining the spotlight on another Quasimodo support at 1.0630.
Areas of consideration:
Those short 1.0922/1.0895 have likely reduced risk to breakeven and banked partial profits at 1.08, with a final take-profit target perhaps resting at H4 Quasimodo support mentioned above at 1.0756.
Breakout sellers sub 1.08 will be watching daily and H4 Quasimodo supports at 1.0768/1.0756 for a reaction. Ultimately, though, they want a H4 close to form beneath 1.0756, unlocking downside to 1.07.
GBP/USD:
The British pound cemented its fourth consecutive drop vs. the buck Thursday, declining to fresh five-week lows at 1.2165. The attempted recovery seen heading into US trade has so far failed to bear fruit, with gains capped under 1.22 and H4 Quasimodo support at 1.2205 serving as resistance. However, the noted Quasimodo formation remains valid until the April swing low (red arrow) at 1.2163 is overthrown.
Elsewhere, the key observation on the weekly timeframe rests at support from 1.2200, a level holding price action higher since April. Scope to push north from here is visible until reaching the 2019 yearly opening level at 1.2739, which aligns closely with a 61.8% Fibonacci retracement ratio at 1.2718. Additional downside, on the other hand, may call for support at 1.1904 to make a show.
The story on the daily timeframe has price action navigating waters south of a familiar consolidation zone between 1.2279-1.2627 (yellow). Traders, in particular sellers, will note there’s room to approach support at 1.2014.
Areas of consideration:
Not only is 1.22 a widely watched figure by and of itself, it comes together with H4 Quasimodo support at 1.2205 and weekly support at 1.2200. H4 action dipping its toe in waters beneath 1.22 could be a move to trip sell-stop liquidity for moves higher. A decisive H4 close back above 1.22 will help confirm this.
Buyers off 1.22 will likely have 1.2245ish in sight as an initial upside target.
In the event H4 bearish candles print sub 1.22, nevertheless, it’s likely we’ll collide with 1.21 from here.

AUD/USD:
The Australian dollar remained on the defensive against the US dollar Thursday, shedding 0.4% as the US dollar index cruised to highs at 100.56.
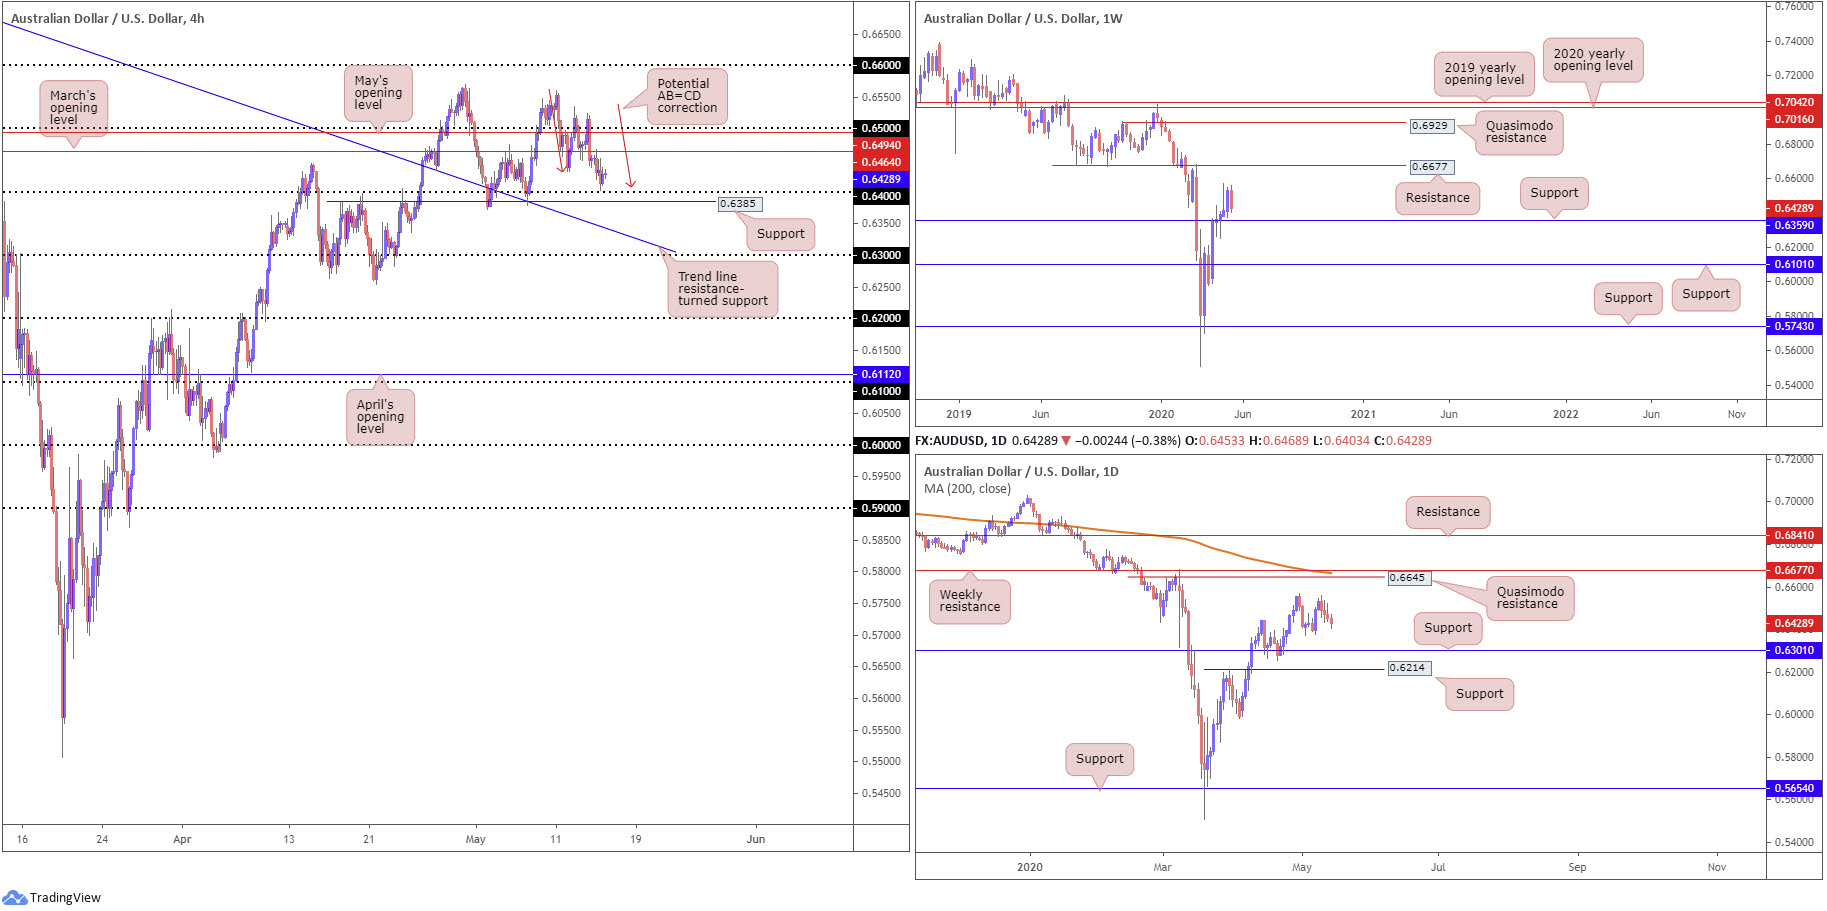
Following an early retest at March’s opening level from 0.6464, price carved out lows just north of 0.64. As underlined in Thursday’s technical briefing, 0.64 aligns closely with H4 support at 0.6385 and a H4 AB=CD correction (red arrows) at 0.6407. As you can see, the AB=CD formation is in motion as we write.
Across the page on the weekly timeframe, we can see upside momentum has diminished this week, suggesting a retest at support from 0.6359. To the upside, traders’ crosshairs are still likely fixed on resistance at 0.6677. Overall, longer-term traders will also note we have been trading lower since the start of 2018, therefore recognising that current upside from multi-year lows at 0.5506 could simply be a bulky pullback before pressing lower.
From the daily timeframe, local support is seen around 0.6370ish, with the possibility of the April 30 high at 0.6569 serving up resistance. Major resistance can be seen at a Quasimodo formation from 0.6645, parked just ahead of the weekly resistance level mentioned above at 0.6677 and a 200-day SMA (orange – 0.6665). Beneath 0.6370, 0.6301 is also noted as possible support.
Areas of consideration:
0.64 boasts appeal, bringing together H4 support at 0.6385 and a bullish H4 AB=CD correction at 0.6407. Intraday traders may already be long at the AB=CD completion, with protective stop-loss orders tucked under 0.6385. As for take-profit targets, traders will be looking at March’s opening level drawn from 0.6464, followed by May’s opening level at 0.6494 and the 0.65 handle.
USD/JPY:
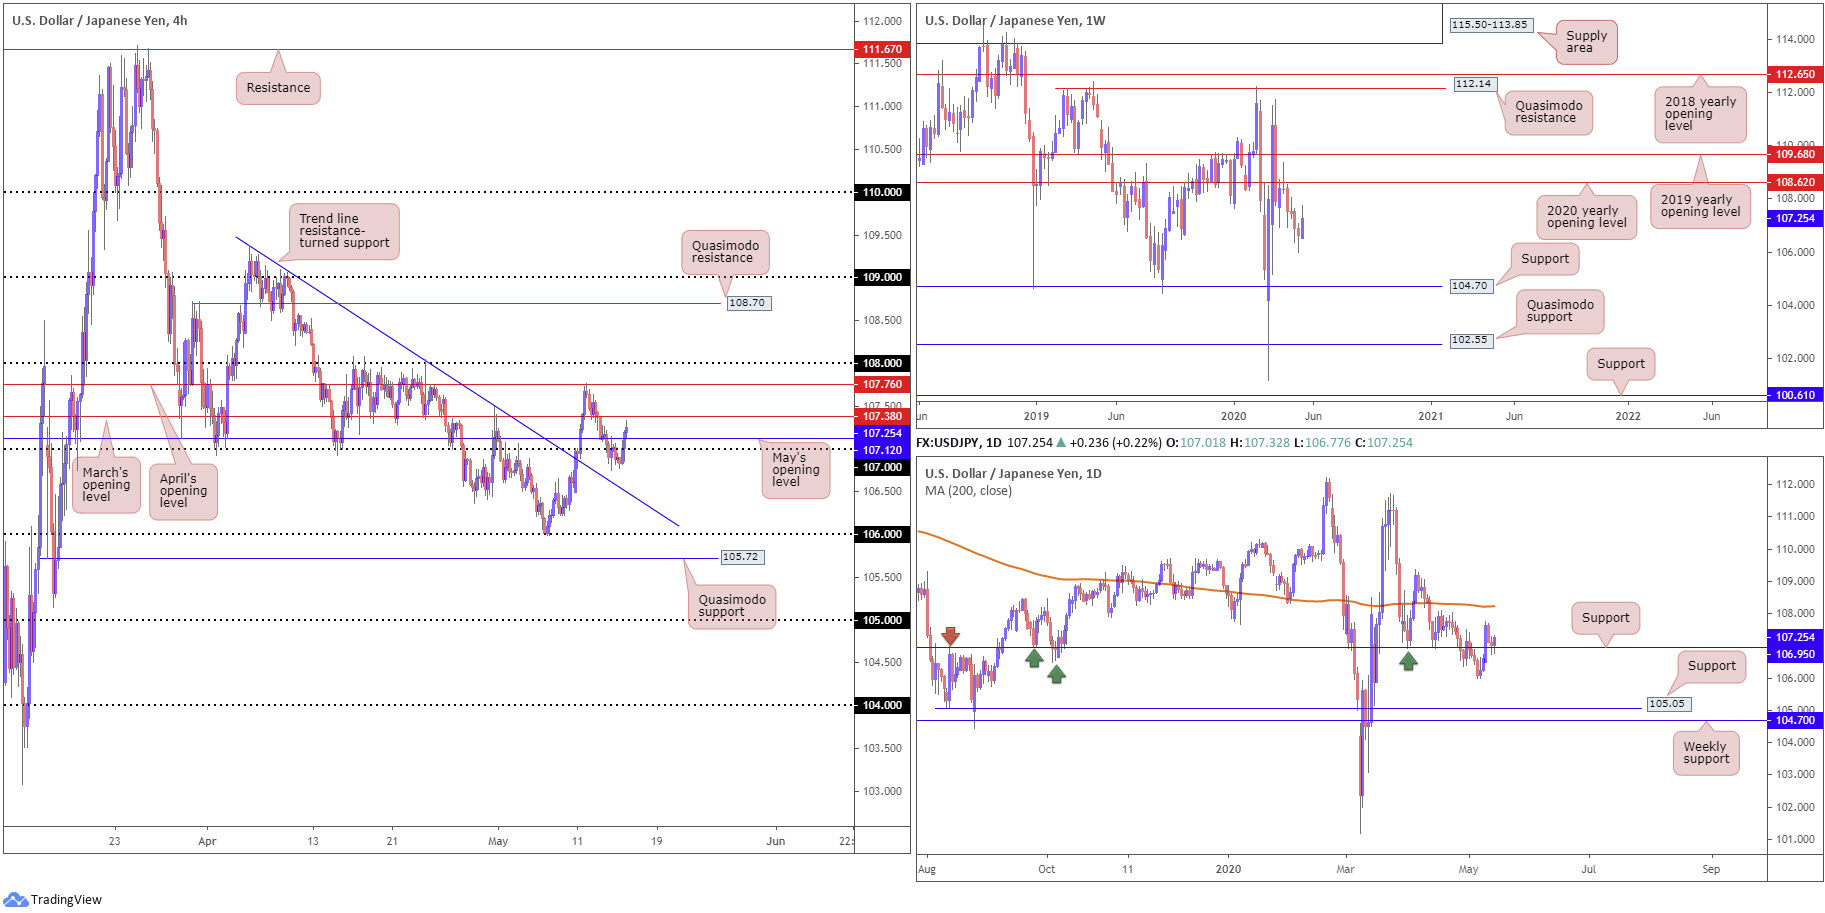
Upbeat risk sentiment, along with a dollar advance north of 100.50, lifted USD/JPY Thursday and snapped a two-day losing streak.
Reclaiming 107+ status and dethroning May’s opening level at 107.12 on the H4 timeframe positions March’s opening level at 107.38 in sight, with a break exposing April’s opening level at 107.76 and ultimately the 108 handle
Despite chalking up a modest recovery this week, the weekly timeframe continues to reflect a bearish tone south of the 2020 yearly opening level at 108.62, with 104.70 positioned as the next support target.
Technical action on the daily timeframe recently shook hands with support at 106.95, throwing the 200-day SMA (orange – 108.23) into the firing range as possible resistance.
Areas of consideration:
For traders who read Thursday’s technical briefing you may recall the following piece (italics):
Daily support at 106.95 and the 107 handle on the H4 timeframe could provide a feasible floor, and may be enough to tempt a recovery today. Conservative buyers, however, may seek a H4 close above March’s opening level at 107.38 before engaging.
While conservative buyers are likely waiting on a H4 close above 107.38, other traders may already be long after closing back above 107. In terms of upside targets, H4 resistances highlighted in bold are likely eyed.
USD/CAD:
For traders who read Thursday’s report you may recall the following points (italics):
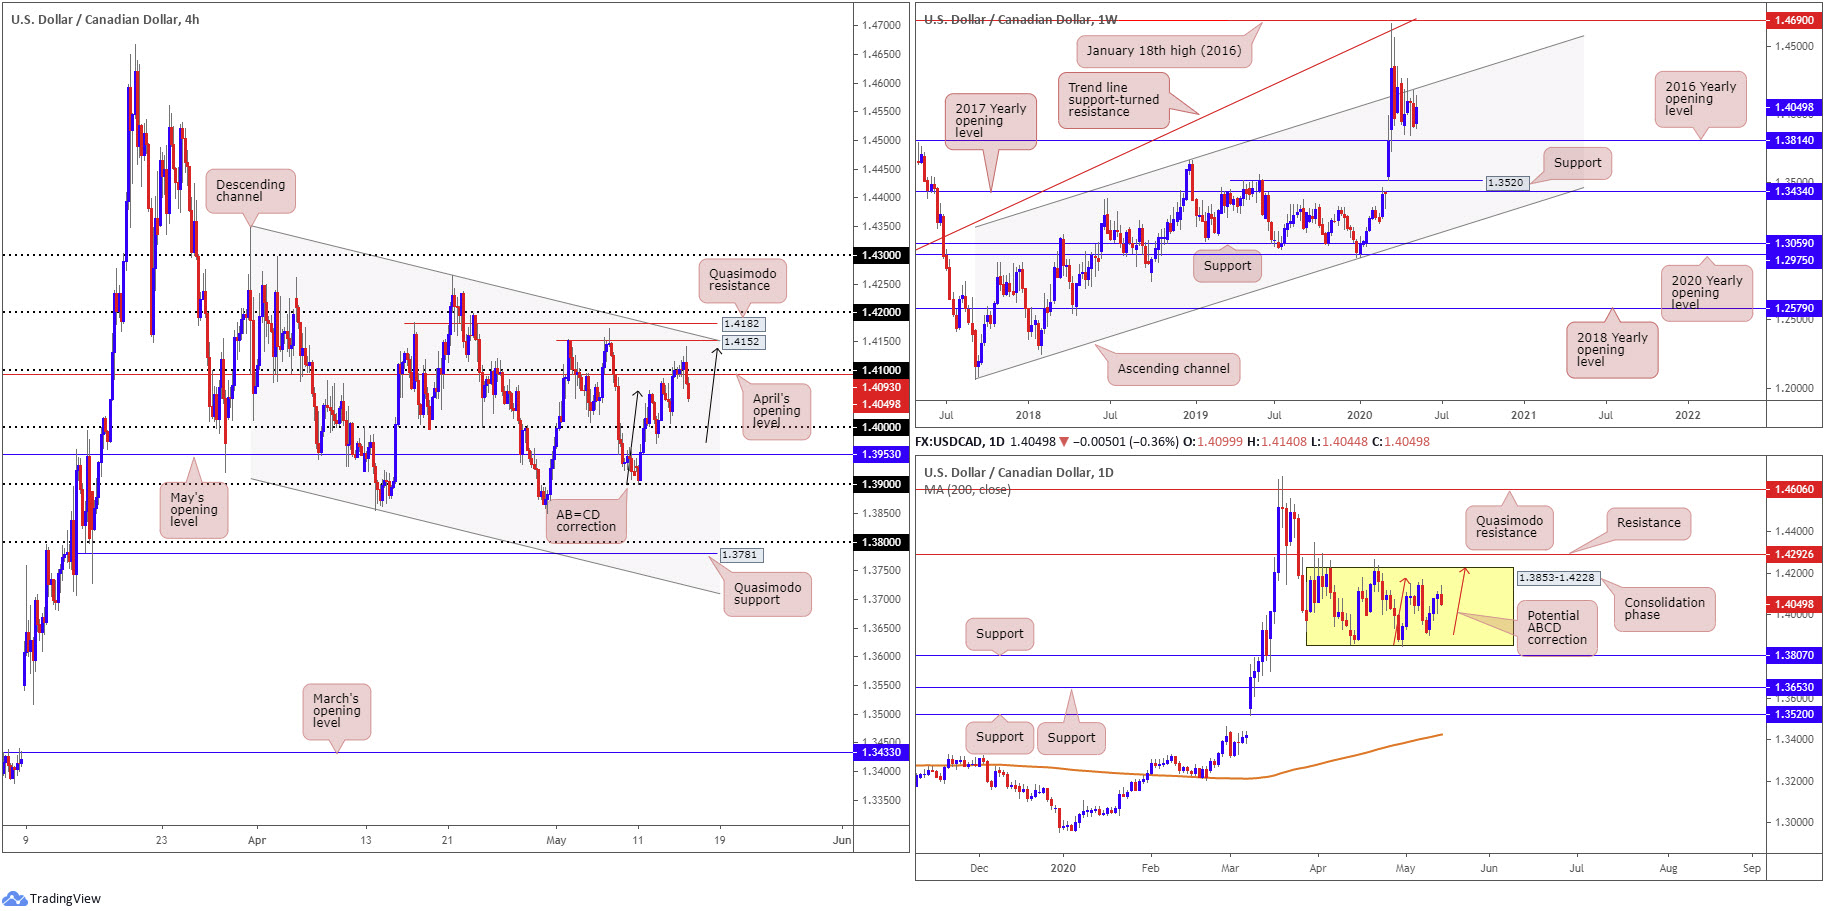
Follow-through moves above 1.41 should not surprise today, owing to H4 Quasimodo resistances seen at 1.4152/1.4182, the channel resistance and AB=CD pattern (black arrows) at 1.4137 forming tight confluence.
As a result, we may see intraday breakout buyers attempt a stab at establishing some ground above 1.41, while active sellers will likely be looking to engage with 1.4152/1.4182.
As you can see, price did indeed extend ground above 1.41 on Thursday, though failed to reach 1.4152/1.4182. The H4 AB=CD pattern at 1.4137, however, did enter the fight before dipping back beneath 1.41. The next support target in view is the key figure 1.40.
Price structure on the weekly timeframe is seen hovering beneath a long-term channel resistance, taken from the high 1.3661. In the event of moves lower from this angle, sellers face possible support off the 2016 yearly opening level at 1.3814. The said base stands in a reasonably healthy position as, overall, we’ve been trending higher since September 2017.
Since kicking off April, we have been carving out a consolidation between 1.3853-1.4228 on the daily timeframe. Inside of these walls, traders may also note a possible ABCD approach (red arrows) to the top edge of the range. Areas outside of this base can be found at resistance drawn from 1.4292 and support at 1.3807. The 200-day SMA (orange – 1.3424), as you can probably see, has been drifting northbound since March.
Areas of consideration:
Follow-through selling sub 1.41 to 1.40 is, of course, a possibility. Lower-timeframe bearish themes, therefore, may be worth considering.
1.40, by and of itself, is a watched figure, though lacks confluence according to chart studies. This invites the possibility of a fakeout through the psychological boundary to May’s opening level at 1.3953. A H4 close back above 1.40 here is a sign sell-stop liquidity beneath 1.40 is being used to lift the pair higher, which may continue north of 1.40 and attract buyers.
USD/CHF:
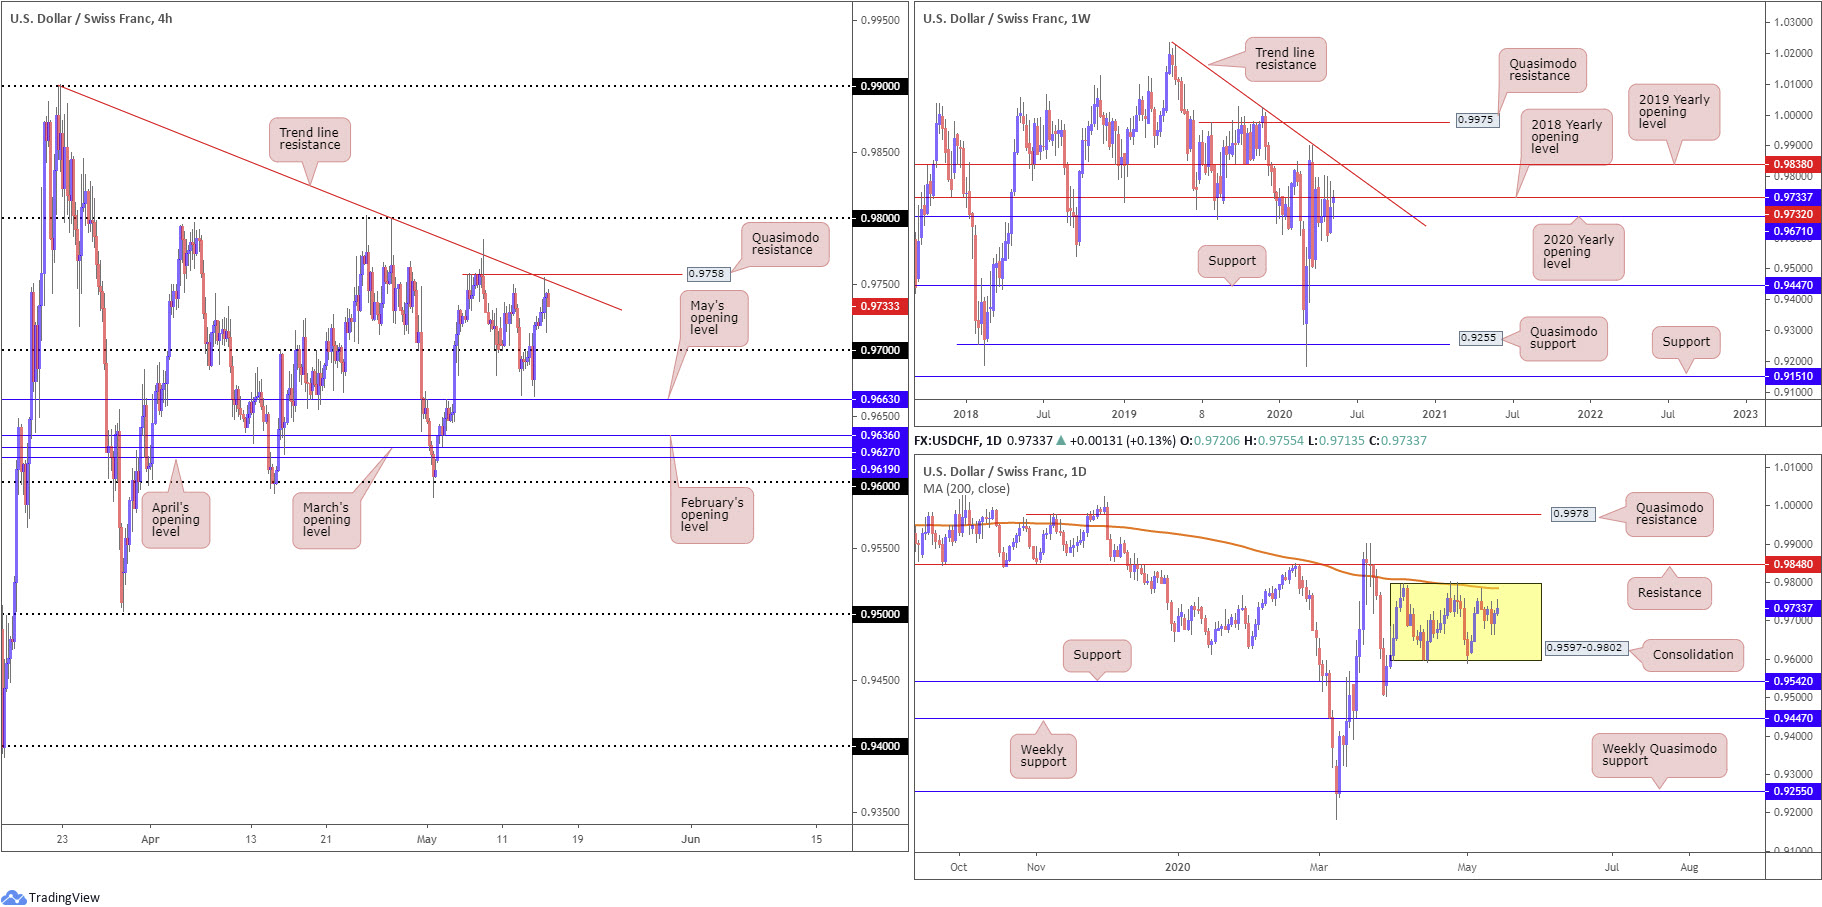
Against the Swiss franc, the US dollar remained comfortable above 0.97 on the H4 timeframe, following Wednesday’s Powell-induced advance.
Bolstered by a broad-based USD bid, the H4 candles built on Wednesday’s advance yesterday, eventually shaking hands with trend line resistance, etched from the high 0.9900, which happens to merge closely with a Quasimodo resistance at 0.9758. Taking out the aforesaid resistances will shine focus on the 0.98 handle.
0.98 remains a significant resistance in this market, as it forms the upper edge of the current daily range between 0.9802/0.9597. Note the 200-day SMA (orange – 0.9785) is also seen circling the upper edge of the said range. Outside of the consolidation, we see daily resistance at 0.9848 while daily support is found at 0.9542.
Longer-term action on the weekly timeframe points out possible resistance off the 2018 yearly opening level at 0.9732. After failing to sustain gains beyond this level over recent weeks, traders are likely expecting the base to hold, maybe forcing a retest at the 2020 yearly opening level from 0.9671, with a break throwing light on the possibility of a run to support coming in at 0.9447.
Areas of consideration:
Having noted weekly price gripping the underside of resistance at 0.9732, price action holding off the H4 trend line resistance and H4 Quasimodo resistance at 0.9758 should not really come as much of a surprise. The rebound seen from the noted H4 levels appears genuine, possibly enticing sellers into the market today in favour of bringing 0.97 back into view.
Yet, in case of continued buying, 0.98 could be the next resistance in line. Given its connection to the upper edge of the current daily range, 0.98 could serve as not only as a take-profit target for longs above 0.97 and additional intraday long positions above 0.9758, but also as a platform for sellers.
Dow Jones Industrial Average:
US stocks finished in positive territory Thursday, lifted amidst notable gains in banking stocks and oil. The Dow Jones Industrial Average added 377.37 points, or 1.62%; the S&P 500 firmed by 32.50 points, or 1.15%, and the tech-heavy Nasdaq 100 concluded higher by 94.35 points, or 1.05%.
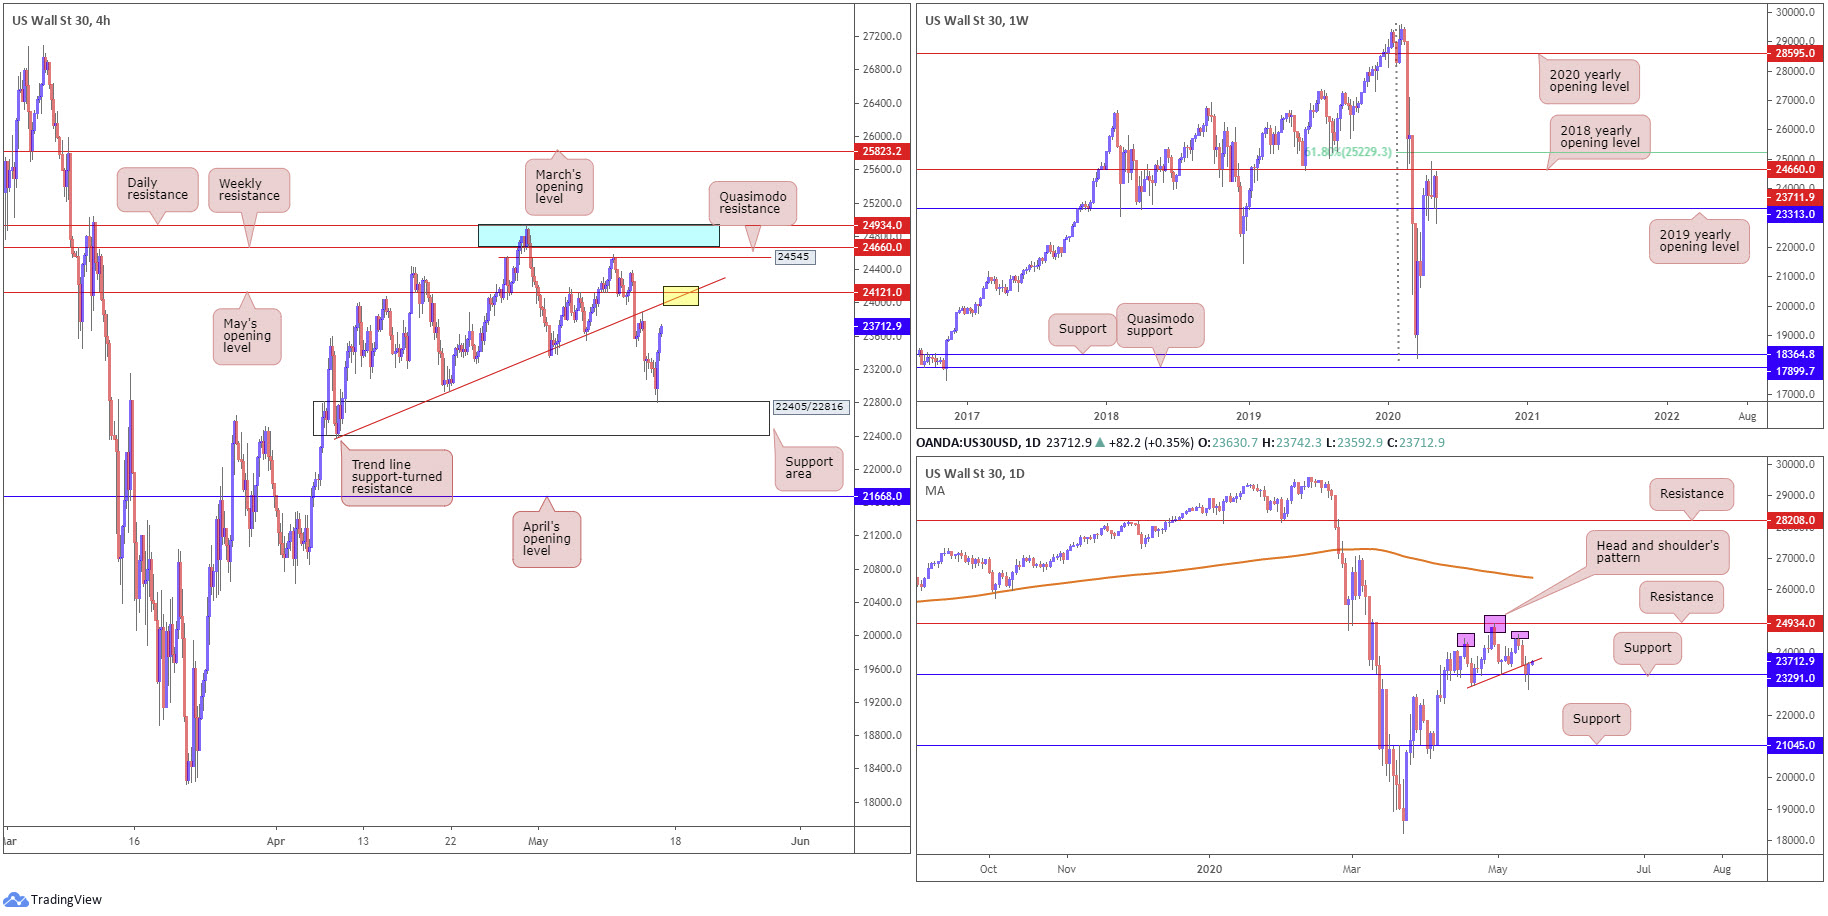
As evident from the H4 timeframe this morning, the support area at 22405/22816 came under fire as we headed into yesterday’s US session, vigorously recovering to highs at 23689. An extension to the upside from current levels may guide the candles towards a trend line support-turned resistance, taken from the low 22530, and May’s opening level coming in at 24121.
On the daily timeframe, we appear to have formed a head and shoulder’s top formation off resistance at 24934. Wednesday confirmed the aforesaid pattern, breaking its neckline from 22934, which resulted in price crossing swords with support at 23291. The aforementioned support remains resilient, forcing price action back to the head and shoulder’s neckline on Thursday. An eventual push lower, nonetheless, could see support at 21045 eventually brought into the mix.
From the weekly timeframe, we can see price recently shook hands with the 2019 yearly opening level at 23313, after failing to overturn the 2018 yearly opening level from 24660. A violation of 23313 shines light on support from 18364.
Areas of consideration:
Weekly price indicates we might be headed for higher ground after rebounding from support at 23313, whereas daily price, while also seen bouncing from support at 23291, faces the possibility of resistance derived from the head and shoulder’s neckline.
Shorter term, the H4 trend line support-turned resistance and May’s opening level at 24121 combination (yellow) may be of interest to sellers should we reach this far north today.
XAU/USD (GOLD):
Spot gold, in $ terms, finished Thursday on relatively strong footing, recording its third consecutive daily gain.
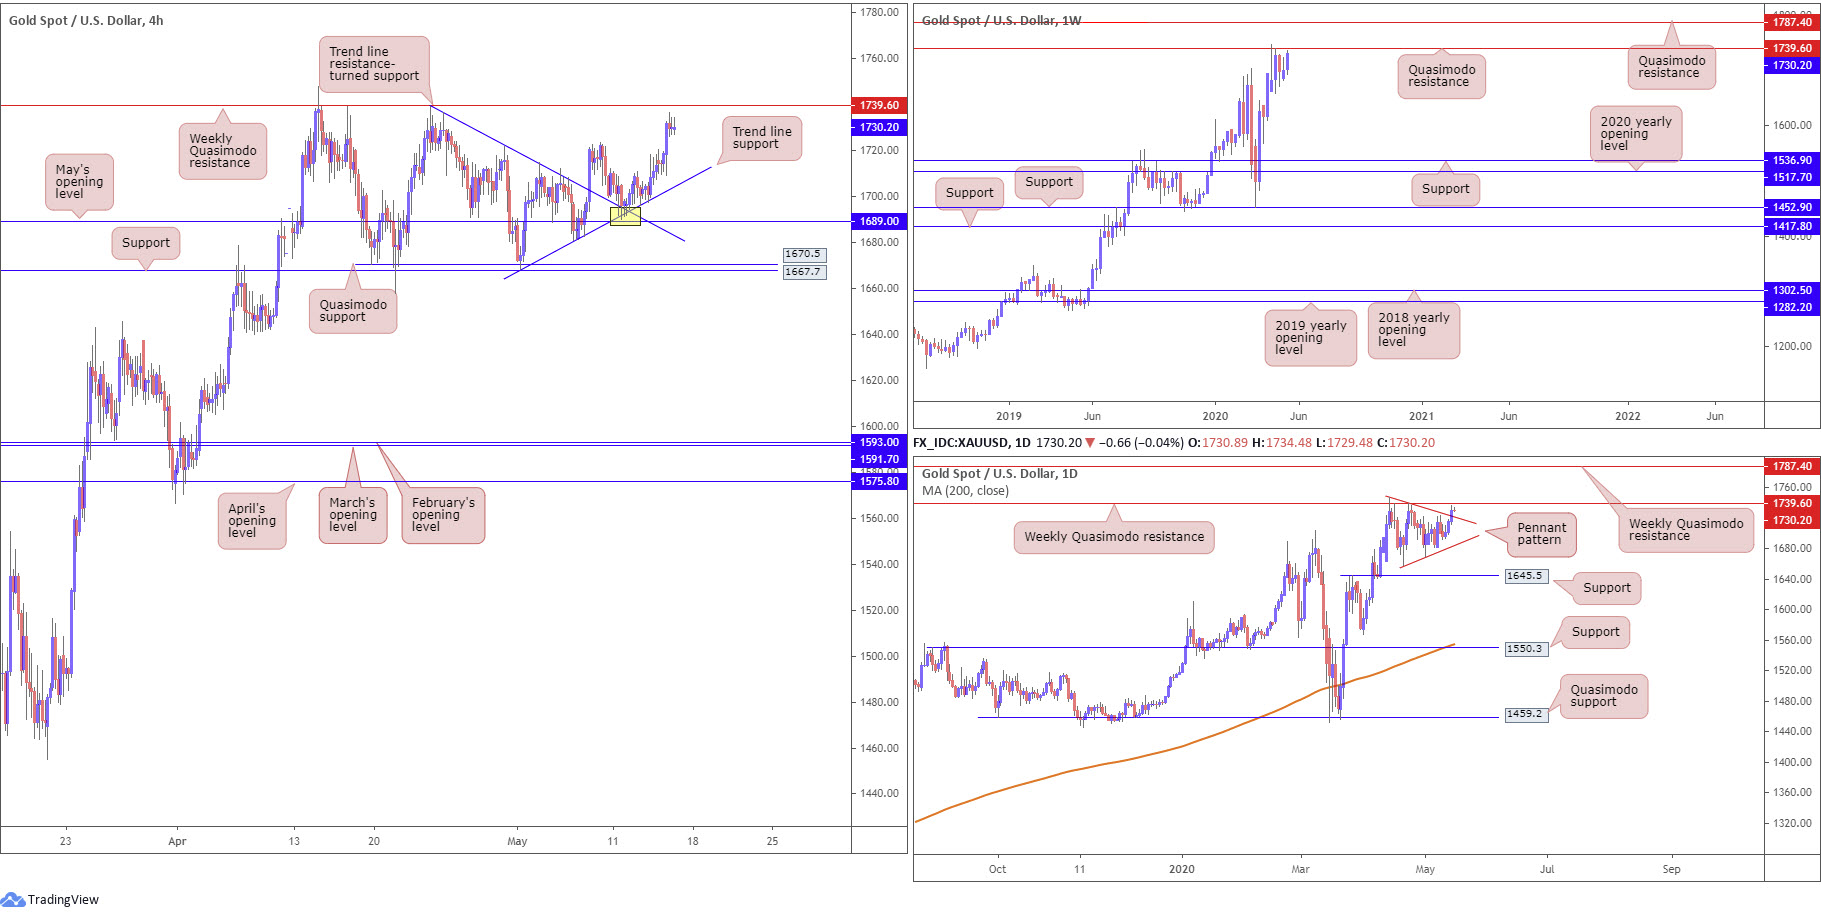
As covered in recent analysis, price action recently shook hands with two merging trend line supports (1739.1/1668.0) on the H4 timeframe, plotted just north of May’s opening level at 1689.0 (yellow). Sustained buying from current levels has seen the 1723.5 May 8 high engulfed, with follow-through moves positioning weekly Quasimodo resistance at 1739.6 within touching distance.
Buyers and sellers on the weekly timeframe continue to battle for position around the underside of Quasimodo resistance at 1739.6. Downside from this region echoes the prospect of eventually reaching support at 1536.9, while a breach of 1739.6 shifts focus towards another layer of Quasimodo resistance at 1787.4. It may also interest some traders to note the primary trend on gold has faced a northerly trajectory since 2016.
In similar fashion to the weekly timeframe, the weekly Quasimodo formation at 1739.6 is also posted as prominent resistance on the daily chart. The difference can be seen with reference to supports: the next support target on the daily timeframe falls in at 1645.5. Pattern traders may also acknowledge the pennant pattern at the underside of the weekly Quasimodo base, established from a high of 1747.7 and a low of 1658.1, recently had its upper boundary breached.
Areas of consideration:
The area of confluence on the H4 timeframe around May’s opening level at 1689.0 was a noted base to keep an eye on. Well done to those who managed to jump aboard the recent advance. Traders long the said zone have likely reduced risk to breakeven around 1723.5, eyeing 1739.6 as an initial take-profit target.
Printing a close above 1739.6 may see longer-term breakout buyers make a show, perhaps taking aim at weekly Quasimodo resistance from 1787.4 as an initial target.
The accuracy, completeness and timeliness of the information contained on this site cannot be guaranteed. IC Markets does not warranty, guarantee or make any representations, or assume any liability regarding financial results based on the use of the information in the site.
News, views, opinions, recommendations and other information obtained from sources outside of www.icmarkets.com.au, used in this site are believed to be reliable, but we cannot guarantee their accuracy or completeness. All such information is subject to change at any time without notice. IC Markets assumes no responsibility for the content of any linked site.
The fact that such links may exist does not indicate approval or endorsement of any material contained on any linked site. IC Markets is not liable for any harm caused by the transmission, through accessing the services or information on this site, of a computer virus, or other computer code or programming device that might be used to access, delete, damage, disable, disrupt or otherwise impede in any manner, the operation of the site or of any user’s software, hardware, data or property.