


Key risk events today:
China Fixed Asset Investment ytd/y; China Industrial Production y/y.
(Previous analysis as well as outside sources – italics).
EUR/USD:
Weekly gain/loss: -0.30%
Weekly close: 1.1254
Weekly perspective:
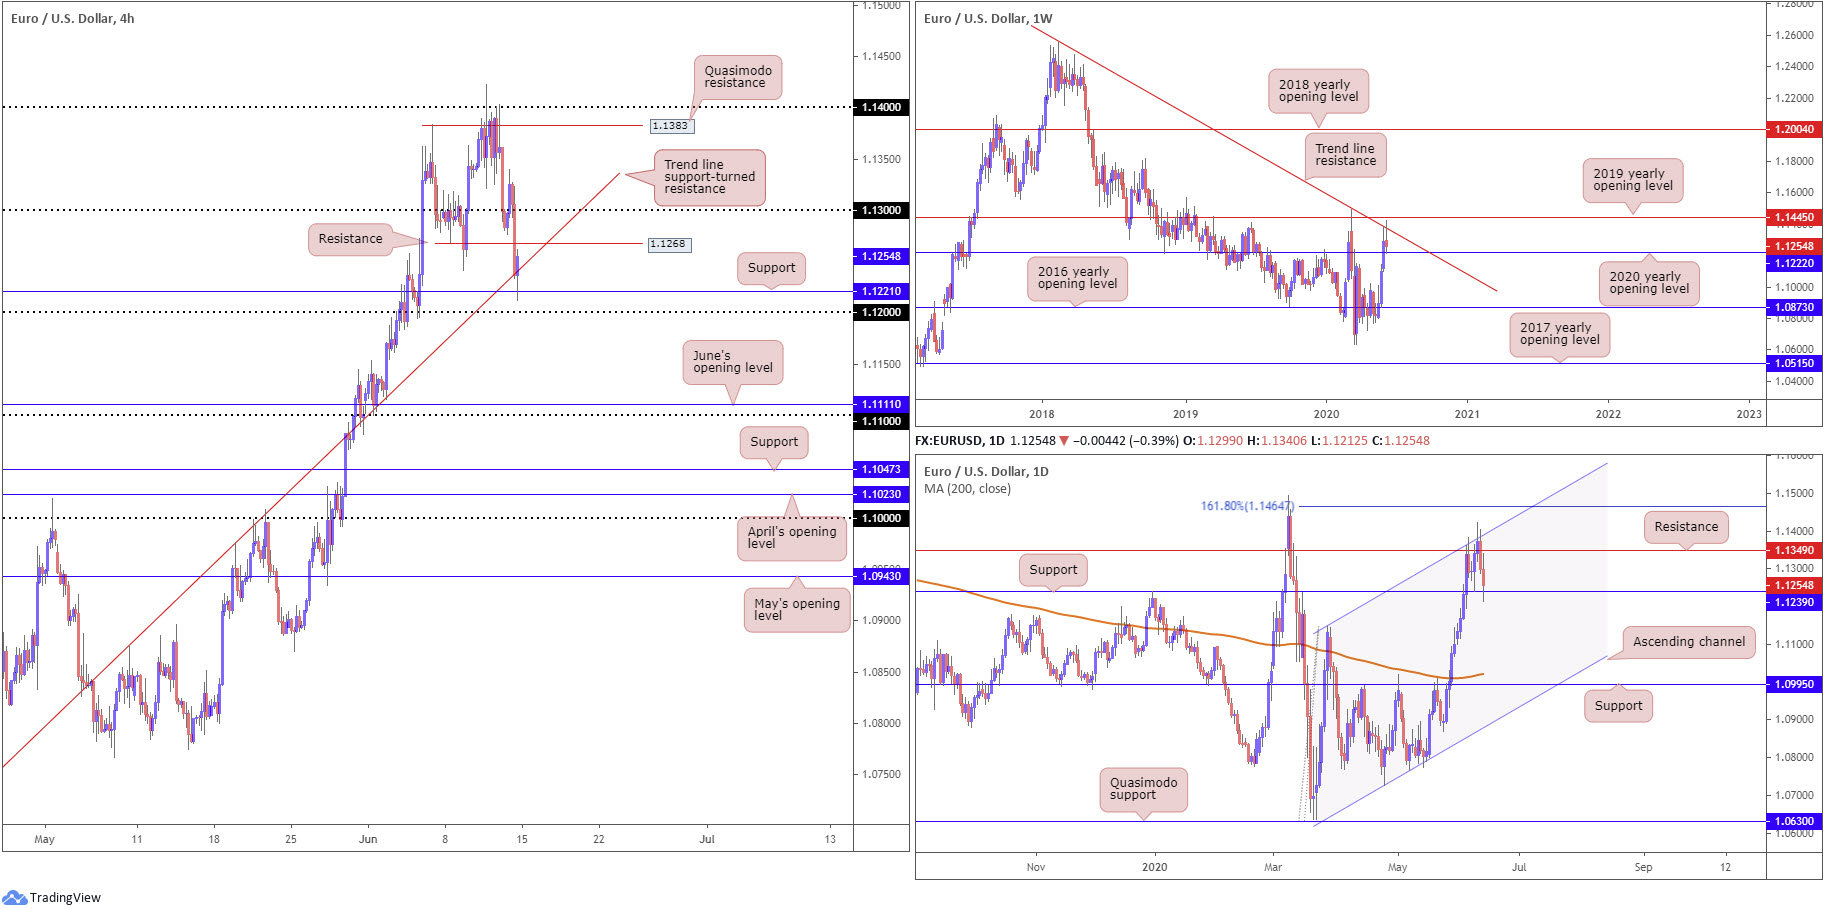
A favourable euro wind elevated EUR/USD over the past three weeks, recently delivering a blow to the 2020 yearly opening level at 1.1222. However, impetus lacked in recent trade after shaking hands with long-standing trend line resistance, extended from the high 1.2555.
Sellers made an appearance and unwound back to 1.1222 by the close. A breach this week has the 2016 yearly opening level at 1.0873 to target, while a resurgence of bidding could have the unit cross swords with the 2019 yearly opening level at 1.1445.
In view of the long-term trend, the pair has remained under pressure since topping in early February 2018.
Daily perspective:
Hefty resistance also emerged on the daily timeframe mid-week at 1.1349, a level converging closely with channel resistance, taken from the high 1.1147.
Friday took the currency pair to support at 1.1239, holding into the close. A break potentially exposes the 200-day SMA (orange – 1.1021), which is on the point of turning higher after drifting south for several months.
H4 perspective:
Friday, based on the H4 timeframe, guided the candles through 1.13 and Quasimodo support at 1.1268 (now a serving resistance), eventually whipsawing through trend line support, taken from the low 1.0727 and testing support at 1.1221, located just north of the 1.12 handle.
Beyond 1.12, the stage appears set for an approach to June’s opening level at 1.1111 and the 1.11 handle.
On the data front, according to the University of Michigan (UoM), consumer sentiment posted its second monthly gain in early June, paced by gains in the outlook for personal finances and more favourable prospects for the national economy due to the reopening of the economy. The turnaround is largely due to renewed gains in employment, with more consumers expecting declines in the jobless rate than at any other time in the long history of the Michigan surveys[1].
Index of consumer sentiment ticked up to 78.9 vs. 72.3, firmly beating the consensus 75.0.
Areas of consideration:
From the weekly timeframe, current trend line resistance may pose a problem for buyers this week. However, there is the possibility buyers could still have a hand in this fight off the 2020 yearly opening level at 1.1222.
A close below the 1.1239 support on the daily timeframe would certainly add weight to the downside, suggesting bearish strategies may be on the cards if we also penetrate the 1.12 handle on the H4.
Assuming a H4 close under 1.12, some sellers may seek an entry on the close of the H4 breakout candle; others might feel a retest at 1.12 may be the better path to explore before pulling the trigger. Irrespective of the entry technique, eyes will be on the 1.11 handle as an initial target.
GBP/USD:
Weekly gain/loss: -1.01%
Weekly close: 1.2535
Weekly perspective:
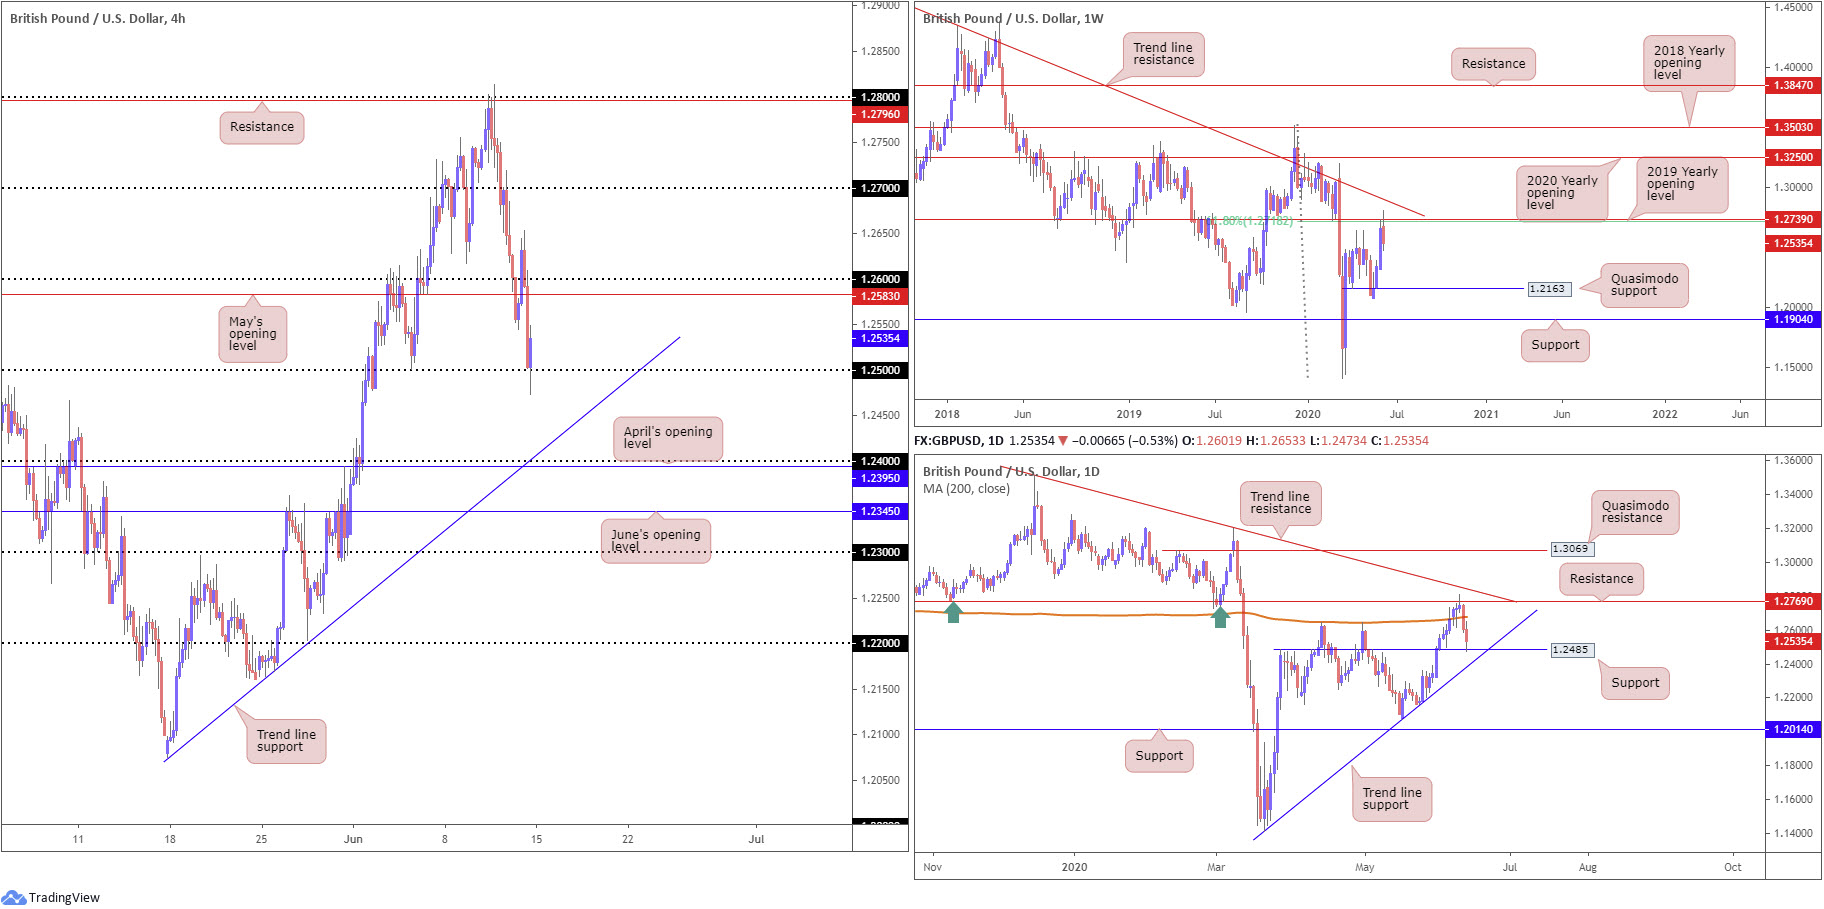
Snapping a three-week bullish phase, healthy selling developed from the 61.8% Fibonacci retracement ratio at 1.2718 and 2019 yearly opening level at 1.2739 in recent movement. It should also be emphasised these levels are positioned beneath a long-term trend line resistance, extended from the high 1.5930.
Increased selling this week, in line with the overall trend, throws Quasimodo support at 1.2163 in the pot as a feasible downside target on this timeframe.
Daily perspective:
Wednesday, as you can see, denied resistance at 1.2769, following through with a dip under the 200-day SMA (orange – 1.2678) Thursday along with continuation selling into support at 1.2485 to close out the week. Traders will note the latter comes packaged with a nearby trend line support, pencilled in from the low 1.1409. Any sustained move beneath here this week would be viewed as an indication the market may want to draw in weekly Quasimodo support mentioned above at 1.2163.
H4 perspective:
Early hours Europe Friday observed H4 (seen clearer on H1) retest the underside of 1.26, fuelled on the back of lower-than-anticipated UK growth data. Monthly gross domestic product (GDP) fell by 20.4% in April 2020, the biggest monthly fall since the series began in 1997, according to the Office for National Statistics[2].
1.26 failed to deliver much in terms of resistance, however, resulting in a two-candle (H4) fakeout forming above the round number. Starved of support, buyers stepped aside and allowed price to welcome 1.25 going into the close. Focus under 1.25 is likely towards trend line support, coming in from the low 1.2075, closely followed by the 1.24 base and April’s opening level at 1.2395.
Areas of consideration:
With H4 mildly surpassing 1.25, albeit holding by the close, and daily price bringing in daily support at 1.2485, a fakeout scenario (running stops under 1.25) likely occurred. This could generate additional buyer interest early week back to 1.26ish.
Closing below daily support at 1.2485, however, signals bearish themes below 1.25 to H4 trend line support highlighted above, in line with the weekly timeframe’s structure.
AUD/USD:
Weekly gain/loss: -1.45%
Weekly close: 0.6866
Weekly perspective:
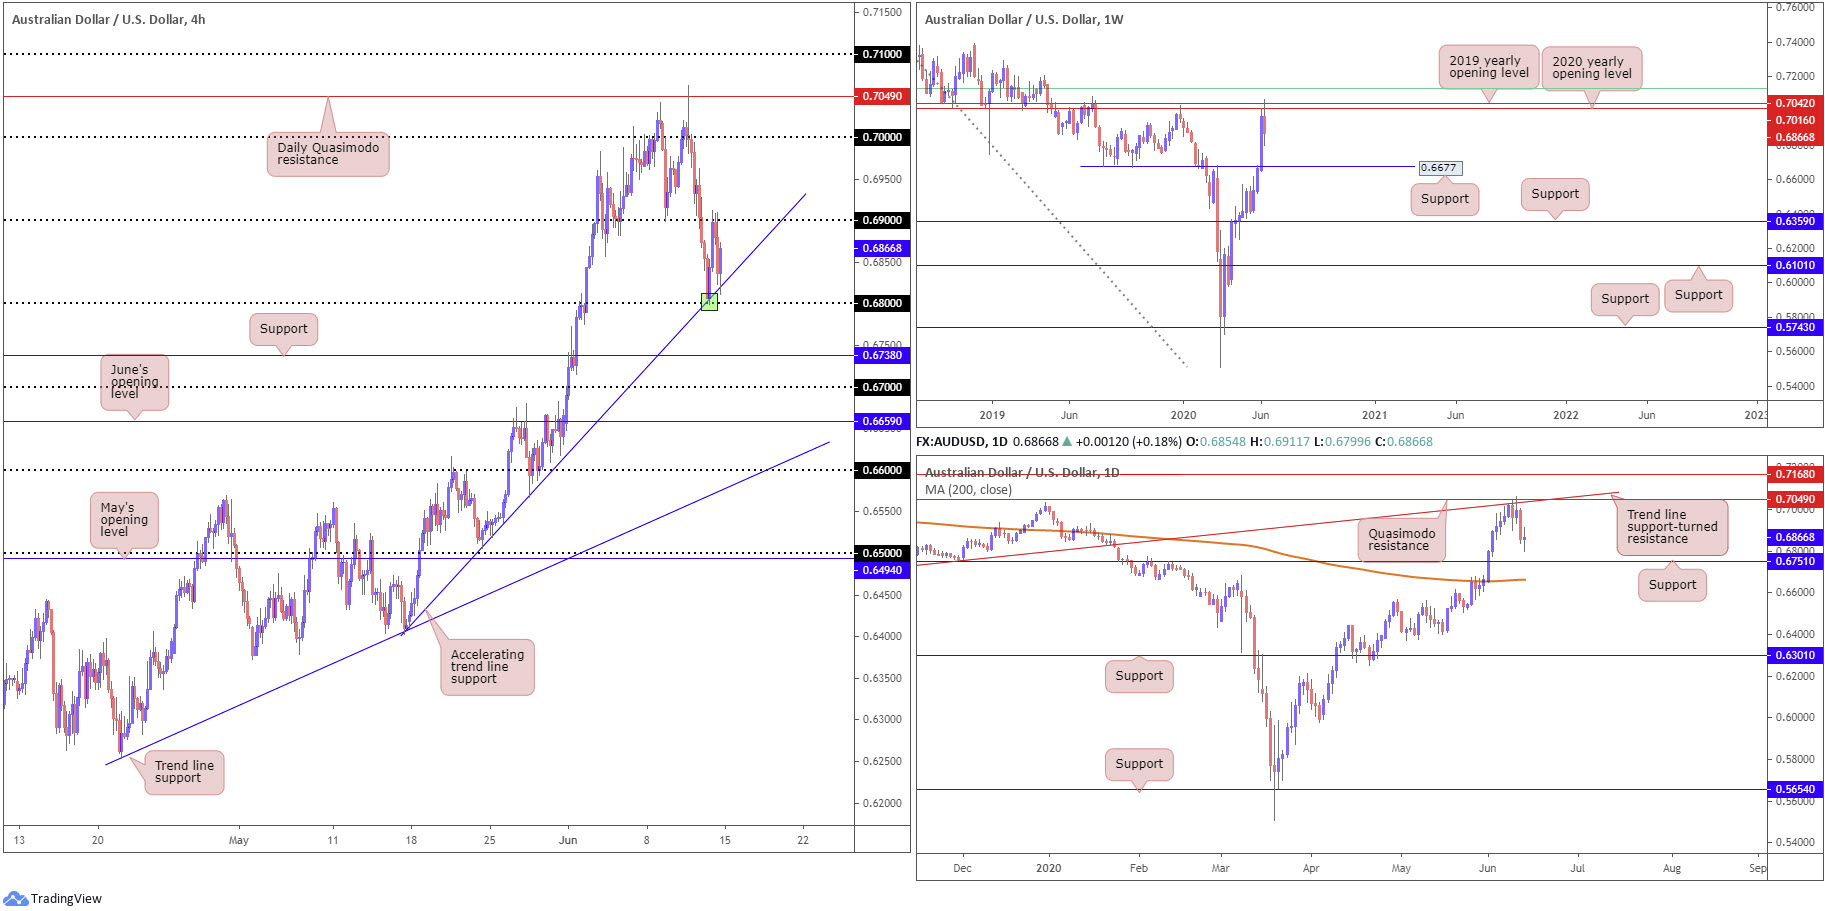
Resistance, forged in the shape of the 2020 yearly opening level and the 2019 yearly opening level at 0.7016 and 0.7042, respectively, challenged buyers last week and snapped a healthy three-week bullish phase. It might also interest some traders to note that just above the said resistances we also have a 61.8% Fibonacci retracement ratio stationed at 0.7128 (green).
While we cannot rule out the possibility of upside attempts, last week’s 100-pip decline spun support at 0.6677 back into the frame as a possible floor worthy of retesting, indicating sellers may want to take things lower this week.
Daily perspective:
Interestingly, daily price also engaged with some heavyweight resistance early week. Converging closely with weekly resistances, daily trend line support-turned resistance, taken from the low 0.6670, and Quasimodo resistance at 0.7049 (also marked on the H4 timeframe) made an appearance.
This turns attention to support coming in at 0.6751 this week, placed above the 200-day SMA (orange – 0.6663).
H4 perspective:
It was aired in Friday’s technical briefing price action traders will be particularly fond of 0.68 intersecting with H4 trend line support (green) for a possible rebound. As evident from the chart, the pair staged a 100-pip+ bounce from the noted angle, crossing into 0.69 before catching a strong offer and retesting the aforementioned trend line support by the close.
Lower than 0.68 sheds light on support at 0.6738 (prior Quasimodo resistance), closely shadowed by the 0.67 handle. Above 0.69, though, traders will be looking to punch back up to 0.70.
Areas of consideration:
The combination of daily support at 0.6751 and H4 support at 0.6738 may stoke (buyer) interest this week in the event we crack 0.68. Yet, in saying this, a run lower to weekly support at 0.6677 could also be on the cards as it merges closely with the 200-day SMA at 0.6663, another potent combination of support for buyers to consider.
Initially though, breaking 0.68 may draw intraday sellers into the fight, targeting daily support 0.6751.
USD/JPY:
Weekly gain/loss: -2.01%
Weekly close: 107.35
Weekly perspective:
Erasing all the prior week’s gains and snapping a four-week bullish phase, last week’s swing lower may reinforce further selling this week.
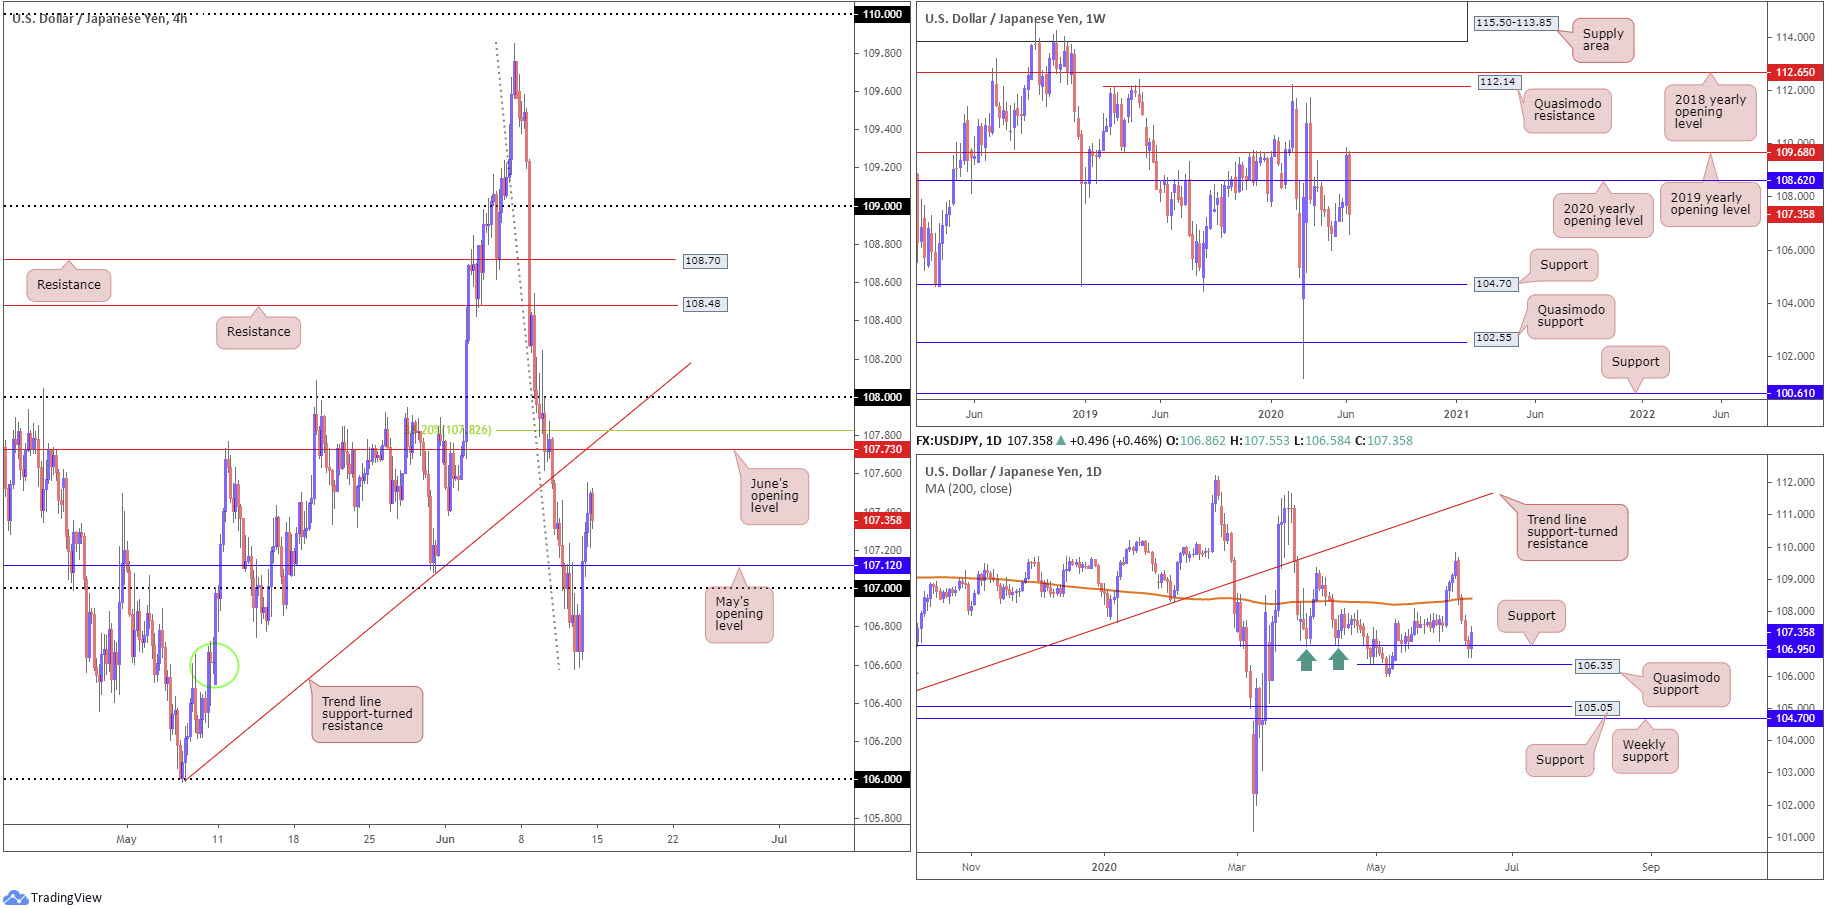
Down more than 200 pips into the week’s wrap, after firmly rejecting the 2019 yearly opening level at 109.68 and cruising through the 2020 yearly opening level at 108.62, this shifts focus to the 105.98 6th May low as the next downside target on this timeframe.
Daily perspective:
Contrary to the weekly timeframe’s position, end-of-week trade had daily movement cross swords with support at 106.95, missing Quasimodo support at 106.35 by a hair.
Friday observed buyers make a comeback off support at 106.95, swinging the 200-day SMA (orange – 108.40) back on to the radar.
So, while weekly price suggests sellers govern the action, daily price indicates buyers are unlikely to give up without a fight. It might also be worth pointing out the 105.98 6th May low underlined on the weekly timeframe forms the extreme low to the aforementioned daily Quasimodo support.
H4 perspective:
Friday, alongside the US dollar index and return of risk flows amid Asia and Europe (favouring a yen sell), propelled USD/JPY through 107 as well as May’s opening level at 107.12.
This brings out June’s opening level at 107.73 as possible resistance this week, stationed close by trend line support-turned resistance (extended from the low 105.99) and the 38.2% Fibonacci retracement ratio at 107.82. 108 is also a level to keep an eye on this week.
Areas of consideration:
Having seen both H4 and daily timeframes suggest scope for an extension to the upside, early week could find bulls push for a test of 107.73 on the H4. However, entering long at current price positions buyers in an awkward stance in terms of risk/reward, therefore a retest at 107.12 may be required before traders feel comfortable pulling the trigger.
Bearish scenarios, thanks to weekly price displaying room to explore lower ground, may also be seen between 107.82/107.73 on the H4, albeit coming with the possibility of a pop to 108 as resistance before sellers make a stance.
USD/CAD:
Weekly gain/loss: +1.22%
Weekly close: 1.3580
Weekly perspective:
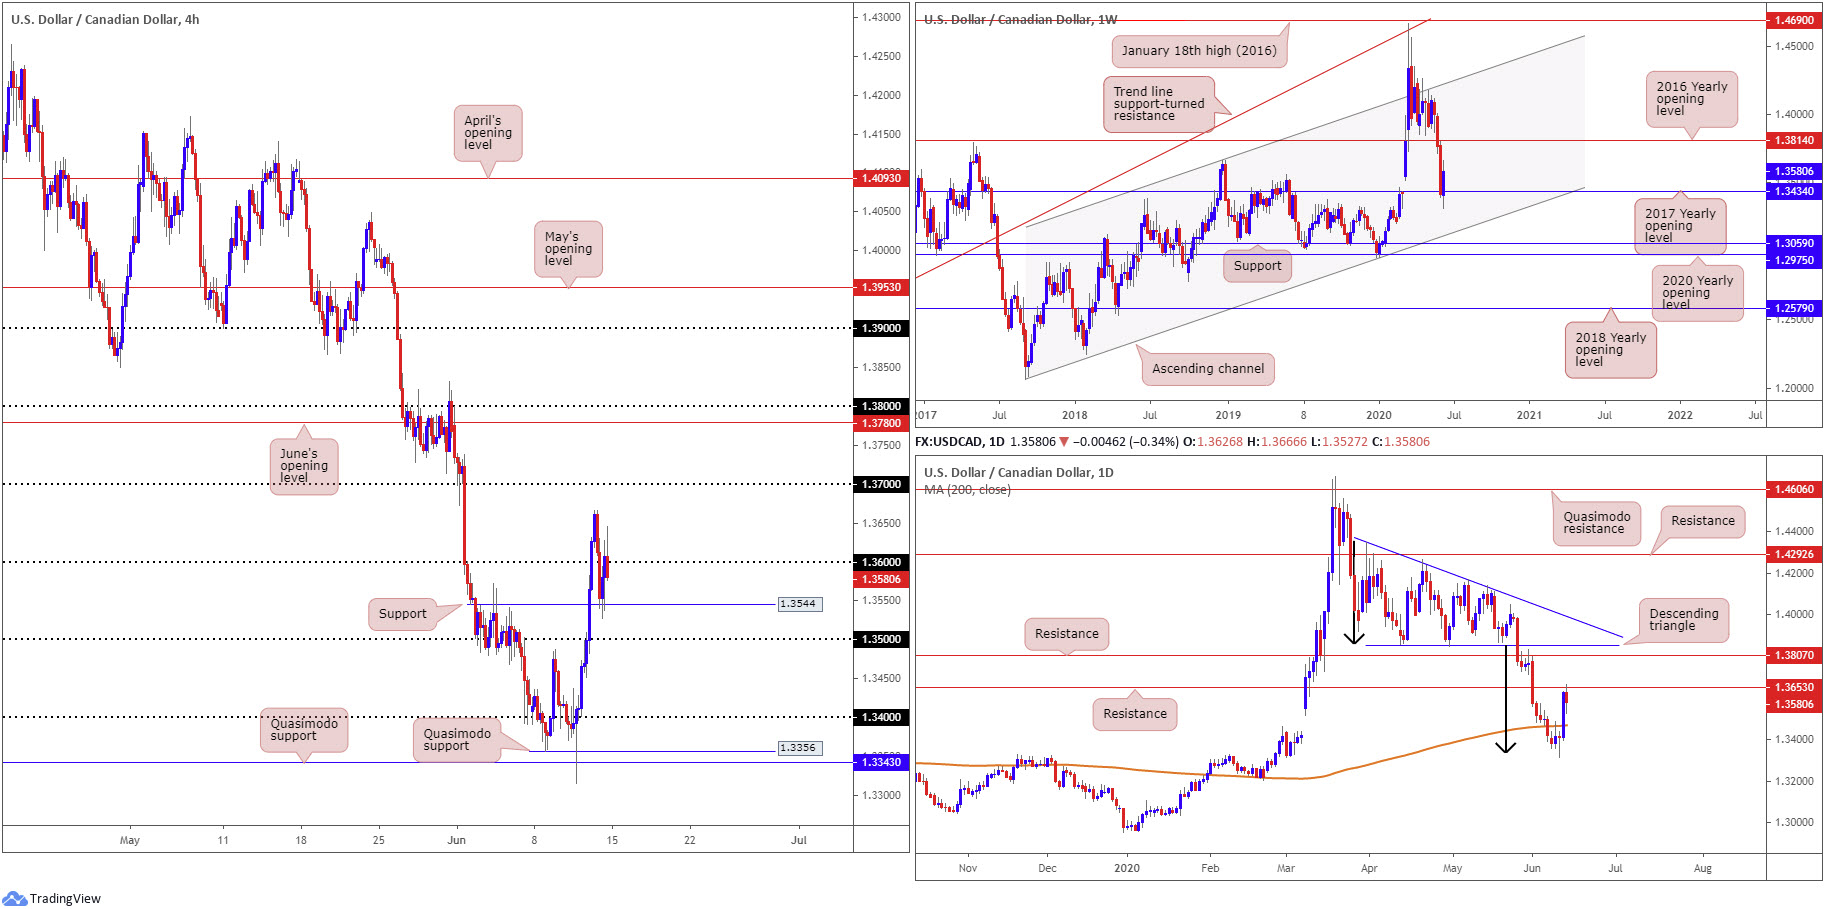
USD/CAD bulls, following three consecutive weeks of losses, went on the offensive last week, drawing impetus from the 2017 yearly opening level at 1.3434.
Theoretically, this promotes the possibility of additional bullish sentiment this week, targeting resistance by way of the 2016 yearly opening level at 1.3814. Clearing 1.3434, on the other hand, places channel support, taken from the low 1.2061, into the limelight.
Daily perspective:
After cruising through the 200-day SMA (orange – 1.3468) and spinning into the descending triangle’s (between 1.4349 and 1.3855) take-profit base at 1.3332 (black arrows), Thursday retook control of the SMA and landed Friday at resistance drawn from 1.3653. Evident from the chart, sellers have made their presence known here, though whether it is enough to hold the base is difficult to judge, given the weekly timeframe suggesting higher moves.
Above current resistance we have another layer of resistance at 1.3807 to look forward to, set just south of the underside of the aforementioned descending triangle.
H4 perspective:
For traders who read Friday’s technical briefing you may recall the following (italics):
Bullish strategies above 1.36 may face opposition off daily resistance at 1.3653 today.
As such, traders long must factor the possibility of a rejection off 1.3653 into trade management, ensuring risk/reward remains favourable.
Daily resistance at 1.3653 likely caught out a number of breakout traders above 1.36 Friday. Well done to those who managed their trade accordingly.
H4 structure, assuming a breach of daily resistance, has 1.37 in line as the next upside target this week. Below 1.36, support rests at 1.3544 (prior Quasimodo resistance), a level which contained downside Friday.
Areas of consideration:
Higher-timeframe buyers are unlikely to commit to the weekly timeframe’s push off support at 1.3434 until we crack daily resistance from 1.3653.
Short-term flow, nonetheless, may see buyers attempt their hand above 1.36 provided the latter is retested as support and held by way of a H4 bullish candlestick pattern (this helps identify buyer intent and offers entry/risk levels to work with).
Another potential scenario to keep an eye on this week is a fakeout through 1.35 into the 200-day SMA (1.3468). A H4 close back above 1.35 will likely be a welcomed sight for buyers.
USD/CHF:
Weekly gain/loss: -1.06%
Weekly close: 0.9517
Weekly perspective:
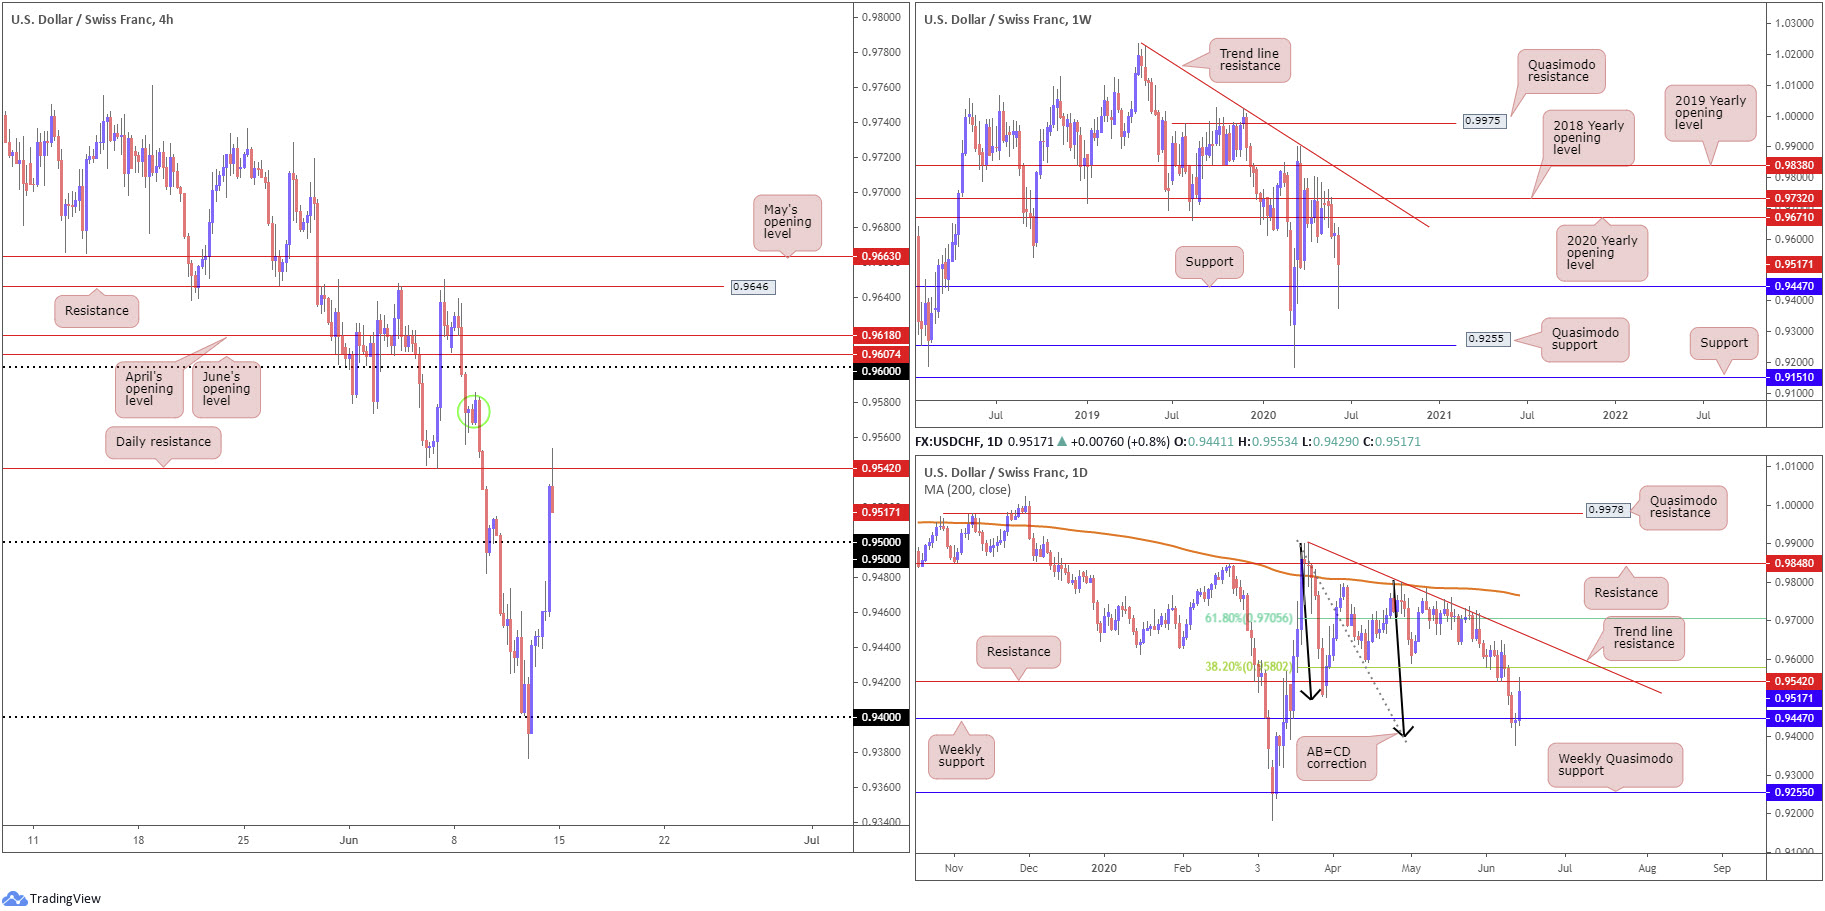
Despite longer-term flow observing an energetic poke below support at 0.9447 to lows at 0.9376, buyers put in a reasonably strong show towards the end of the week and erased a large portion of the week’s losses.
Recent movement may reach out to buyers this week and throw the 2020 yearly opening level at 0.9671 back into the fold, stationed close by the 2018 yearly opening level at 0.9732.
Irrespective of the way we swing going forward, 0.9671 and 0.9447 are heavy-duty levels on this scale.
Daily perspective:
The break of current weekly support threw breakout sellers into a bear trap as daily buyers vigorously defended AB=CD structure at 0.9395. The initial upside target out of the daily AB=CD pattern, traditionally speaking, can be found at the 38.2% Fibonacci retracement ratio at 0.9580 (derived from legs A-D), positioned above resistance plotted at 0.9542 which hit Friday.
It is possible, according to traditional measures, the final AB=CD target might also be met at 0.9705, the 61.8% Fibonacci retracement ratio from legs A-D. This implies a push above trend line resistance, taken from the high 0.9901.
H4 perspective:
Traders who remained long from 0.94, a noted support level in recent analysis, ended the week in strong gains, overthrowing 0.95 to land at daily resistance underlined above at 0.9542.
Breaching daily resistance this week has supply around 0.9570ish to contend with (green circle), with a break exposing the 0.96 handle and June and April’s opening levels at 0.9607 and 0.9618, respectively. Beyond this point, resistance waits at 0.9646.
Areas of consideration:
Traders long 0.94 likely booked a large portion of their position at 0.95 and at daily resistance from 0.9542.
According to the AB-CD daily take-profit projections we may head above the noted daily resistance (0.9542) this week for 0.9580ish, perhaps enough to draw in sellers off 0.9618/0.96 (April and June’s opening levels and the round number 0.96) on the H4 before turning lower. Therefore, 0.9618/0.96 is certainly a base to watch this week as a potential reversal area.
The above may also instigate intraday bullish strategies north of the current daily resistance this week, targeting 0.9580/0.96.
Dow Jones Industrial Average:
Weekly gain/loss: -5.65%
Weekly close: 25554
Weekly perspective:
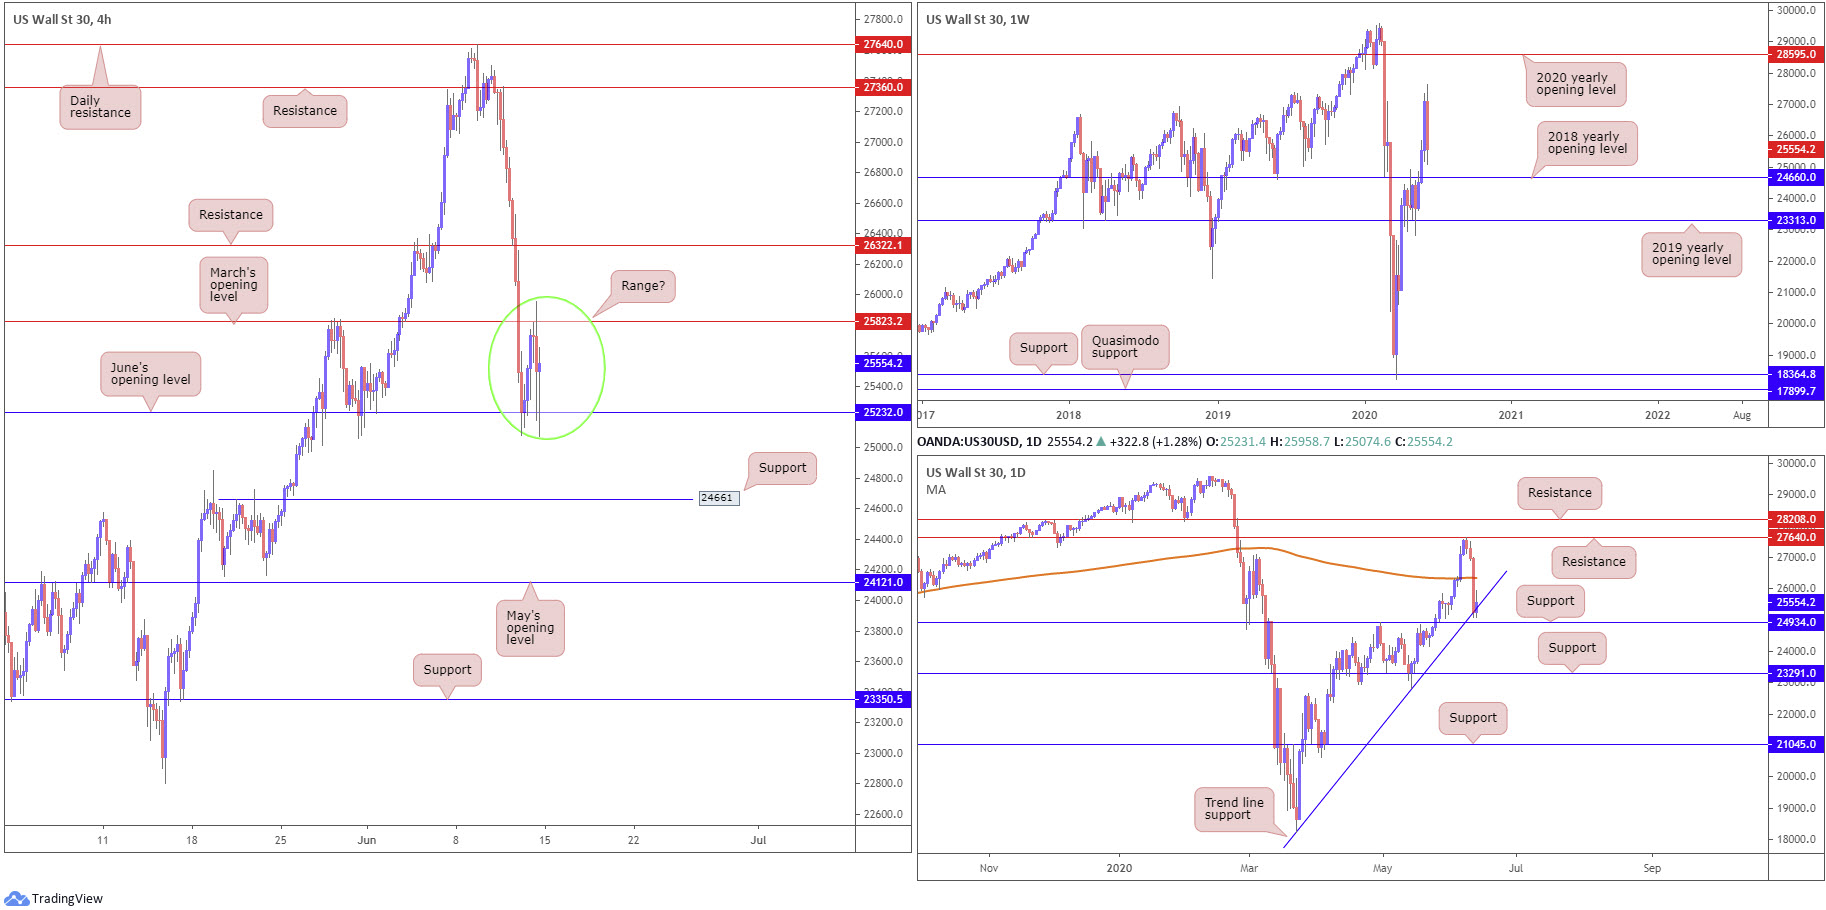
Last week’s stronger-than-expected downturn poured cold water on reaching the 2020 yearly opening level at 28595.
Recent moves snapped a three-week bullish phase and erased the prior week’s gains, settling just north of the 2018 yearly opening level at 24660. Consequently, this is a level worth watching this week.
Daily perspective:
After topping just ahead of resistance at 27640 earlier in the week, Thursday towed price through the 200-day SMA (orange – 26349) and threw Friday into trend line support, taken from the low 18213.
Although off best levels, trend line support maintained a presence Friday. If this level caves in, traders have support to contend with at 24934, a level putting forward strong historical significance dating as far back as February 2019.
H4 perspective:
Major US benchmarks recovered somewhat Friday, a day after the Dow dropped nearly 7%. The Dow Jones Industrial Average climbed 477.37 points, or 1.90%; the S&P 500 rose 39.21 points, or 1.31%, and the tech-heavy Nasdaq 100 concluded higher by 75.30 points, or 0.79%.
Technically, Thursday concluded punching into support at 25232, shaped in the form of June’s opening level. Friday rebounded to March’s opening level at 25823, followed by a return to 25232. This may, assuming another successful defence off 25823 this week, form the beginnings of a consolidation phase.
Outside of 25823/25232, resistance is set at 26322 and support falls in at 24661 (prior Quasimodo resistance).
Areas of consideration:
Lower-timeframe range traders may be drawn to 25823/25232 today/early week, seeking setups that coincide with range limits.
Breaking 25232, according to daily support at 24934, offers limited room for breakout sellers to work with.
H4 support at 24661 is interesting, though, owing to the level melting with weekly support at 24660 (2018 yearly opening level). This would, of course, entail marginally violating daily support at 24934.
H4 resistance at 26322 may also appeal this week, having seen it merge with the 200-day SMA.
XAU/USD (GOLD):
Weekly gain/loss: +2.86%
Weekly close: 1729.6
Weekly perspective:
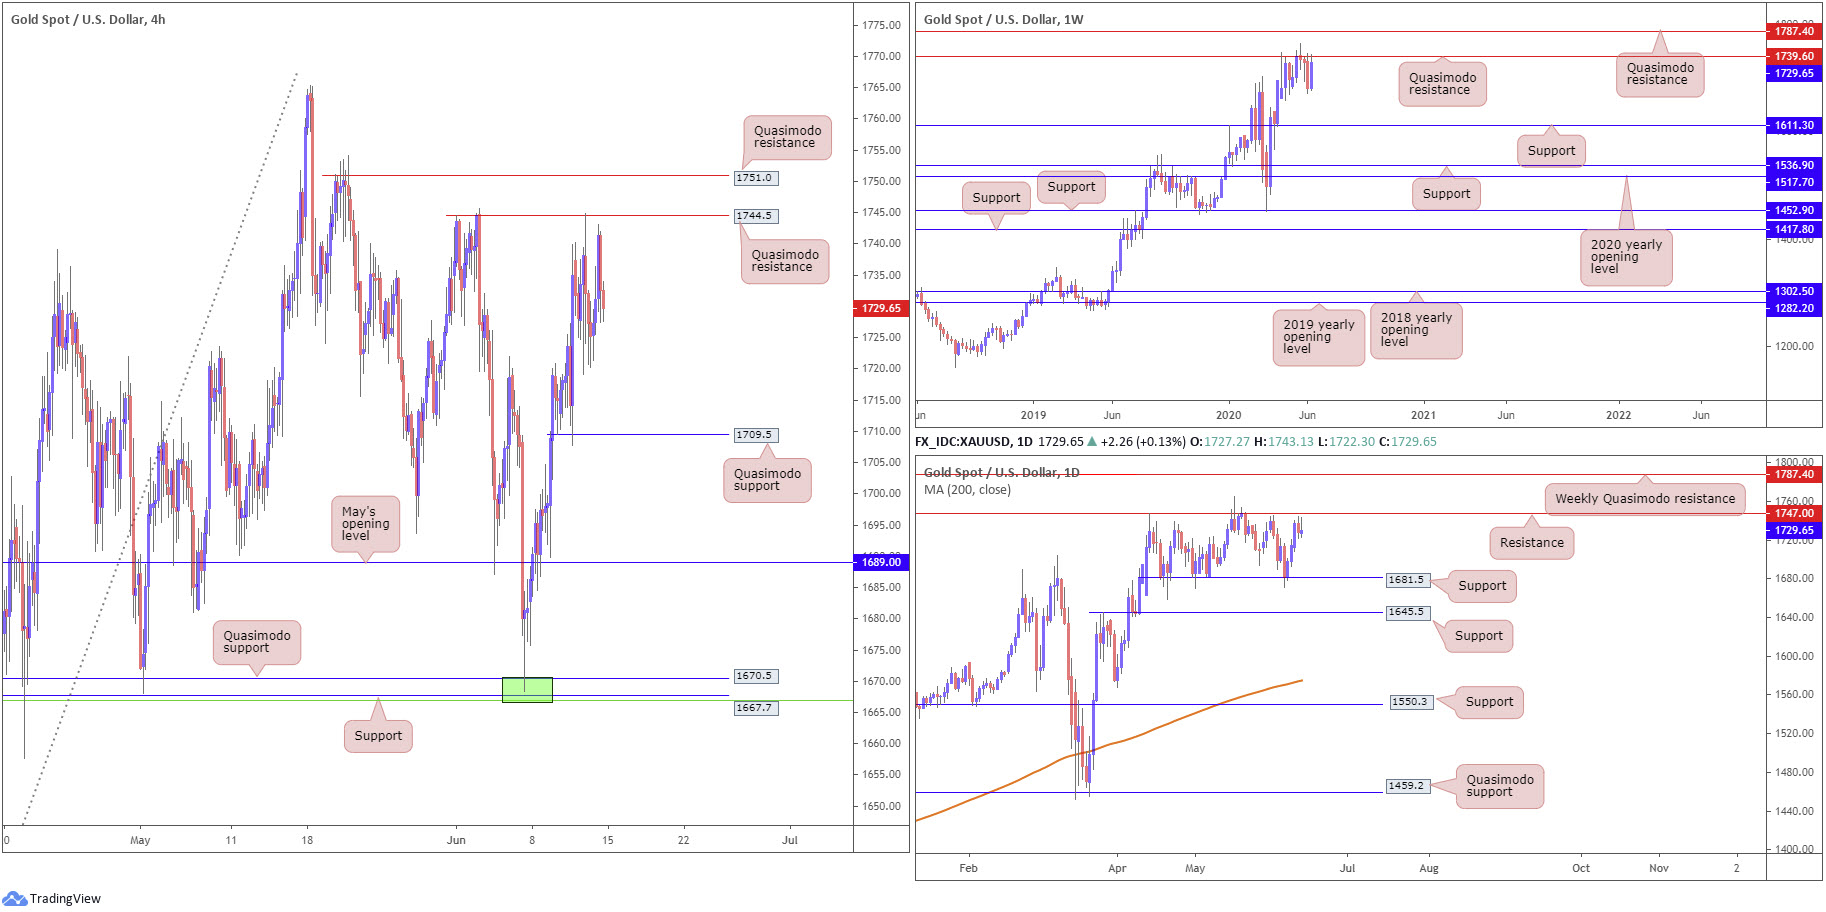
Since mid-April, buyers and sellers have been battling for position below Quasimodo resistance at 1739.6, sited under another layer of Quasimodo resistance at 1787.4.
A decisive turn lower from current price moves support at 1611.3 into view.
Daily perspective:
A closer reading of price action on the daily timeframe reveals candles remain entrenched within a range between resistance at 1747.0 and support pencilled in at 1681.5.
A breakout to the downside this week shines the spotlight on support at 1645.5; turning higher, however, highlights the weekly Quasimodo resistance at 1787.4.
H4 perspective:
XAU/USD prices finished Friday off best levels, essentially unchanged on the session. Quasimodo resistance at 1744.5 remains a key intraday barrier on the H4 timeframe, proving its worth Thursday. Above, another Quasimodo resistance is seen at 1751.0, while elbowing lower this week draws in Quasimodo support positioned at 1709.5, with a break unmasking May’s opening level at 1689.0.
Areas of consideration:
Although the trend has faced north since 2016, all the while weekly Quasimodo resistance remains intact this will likely deter prospective buyers.
A possible scenario for sellers on the H4 timeframe this week is a pop above current Quasimodo resistance at 1744.5 to Quasimodo resistance at 1751.0, consequently tripping stops and drawing in daily resistance at 1747.0. H4 Quasimodo support at 1709.5 represents the initial target.
Alternatively, a break under 1709.5 may clear the pathway south to May’s opening level at 1689.0, stressing intraday bearish themes might be in store.
The accuracy, completeness and timeliness of the information contained on this site cannot be guaranteed. IC Markets does not warranty, guarantee or make any representations, or assume any liability regarding financial results based on the use of the information in the site.
News, views, opinions, recommendations and other information obtained from sources outside of www.icmarkets.com.au, used in this site are believed to be reliable, but we cannot guarantee their accuracy or completeness. All such information is subject to change at any time without notice. IC Markets assumes no responsibility for the content of any linked site.
The fact that such links may exist does not indicate approval or endorsement of any material contained on any linked site. IC Markets is not liable for any harm caused by the transmission, through accessing the services or information on this site, of a computer virus, or other computer code or programming device that might be used to access, delete, damage, disable, disrupt or otherwise impede in any manner, the operation of the site or of any user’s software, hardware, data or property.
[1] http://www.sca.isr.umich.edu/
[2] https://www.ons.gov.uk/economy/grossdomesticproductgdp/bulletins/gdpmonthlyestimateuk/april2020#gdp-fell-by-204-in-april-2020