


Key risk events today:
Australia Monetary Policy Meeting Minutes; UK Job’s Data; US Building Permits; Fed Chair Powell Testifies.
(Previous analysis as well as outside sources – italics).
EUR/USD:
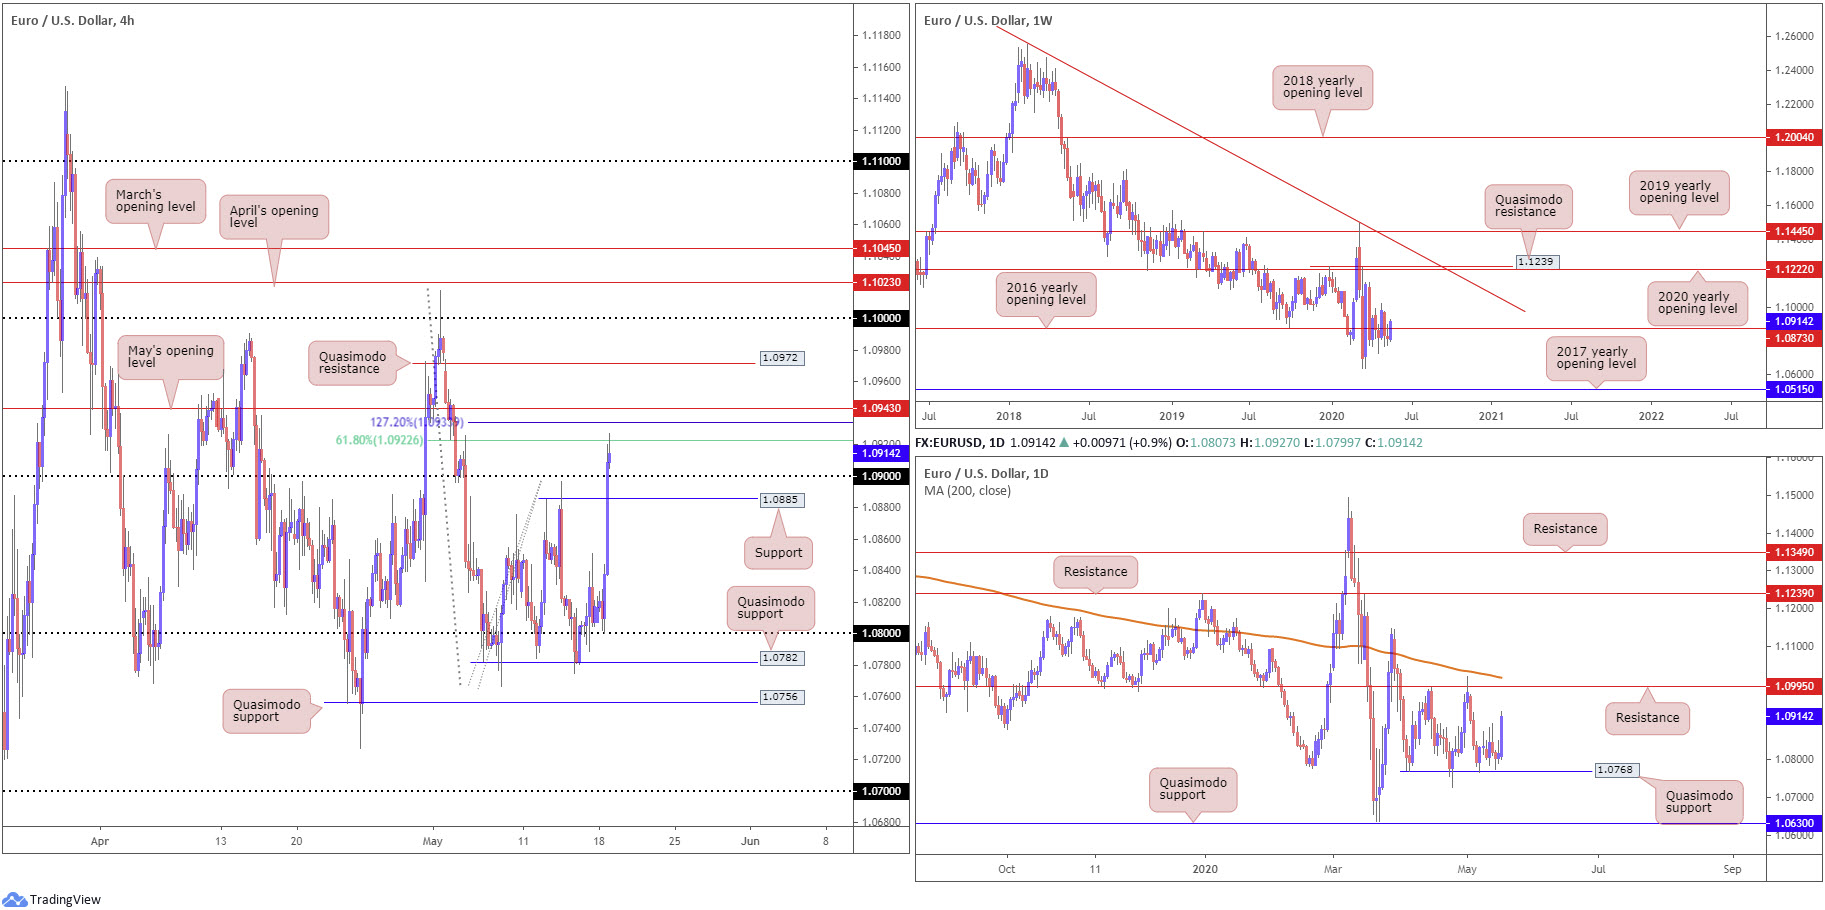
The euro kicked off the week strongly amid heightened risk appetite. EUR/USD rebounded from 1.08 following a slowing in Eurozone COVID-19 cases and reports France and Germany are now backing joint EU debt issuance.
H4 price swung through orders at 1.09, connecting with a 61.8% Fibonacci retracement ratio at 1.0922, a level sited just north of a 127.2% Fibonacci extension point at 1.0933 and May’s opening level at 1.0943. Potential support can be found at 1.09 and maybe from 1.0885.
Further afield, we have weekly price attempting to regain a footing above the 2016 yearly opening level at 1.0873, with further buying potentially setting the stage for a run to the 2020 yearly opening level at 1.1222. A bump lower from here this week, though, could have multi-year lows enter at 1.0635. Overall, it’s also worth reminding ourselves the pair has remained in a long-term downtrend since topping in early 2018.
Price movement on the daily timeframe has been somewhat sluggish of late, shifting between gains and losses ahead of Quasimodo support from 1.0768. Monday’s advance, however, has positioned resistance back in view at 1.0995, followed by the 200-day SMA (orange – 1.1017).
Areas of consideration:
Although the overall trend points south, shorter-term flow on the H4 timeframe suggests 1.09 may be brought into the frame as support today. Yet, traders are also urged to pencil in the possibility of a fakeout through the round number to H4 support at 1.0885, before buyers step in. Ultimately, the H4 61.8% Fibonacci retracement ratio at 1.0922 and the H4 127.2% Fibonacci extension point at 1.0933, as well as May’s opening level at 1.0943, represent upside targets. However, there is a possibility we can reach daily resistance at 1.0995.
GBP/USD:
For those who read Monday’s technical briefing you may recall the following (italics):
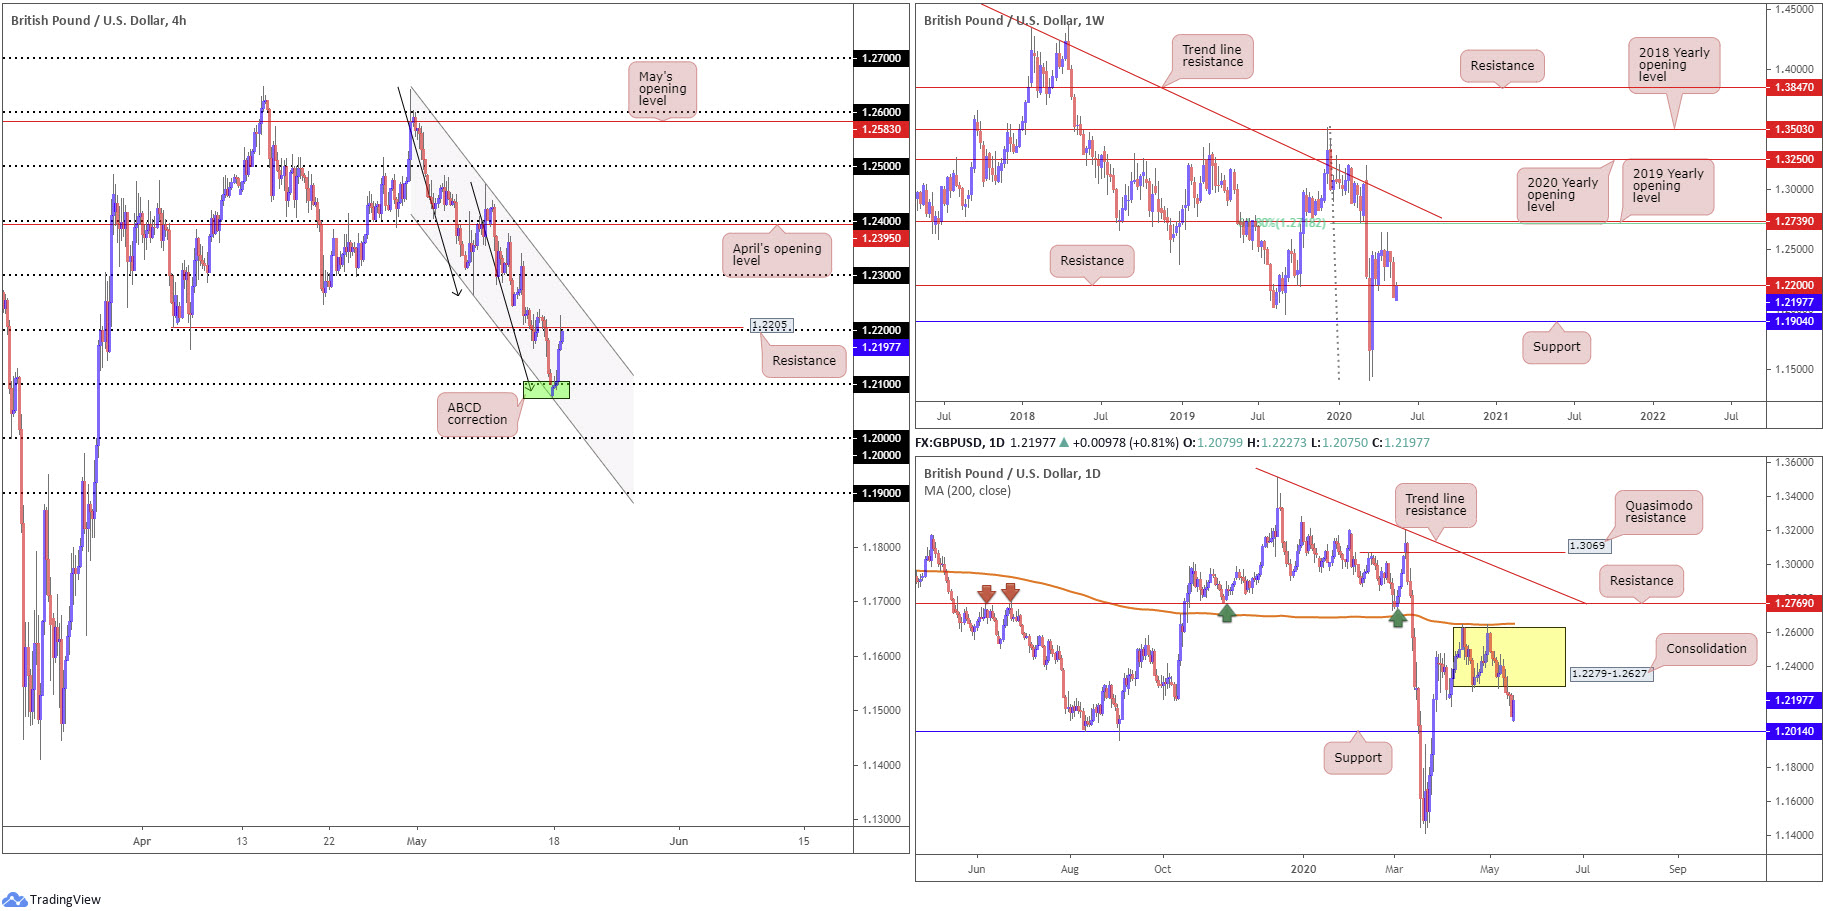
Price action (Friday) eclipsed bids around 1.22 and delivered H4 candles into 1.21, a level that draws a close connection to an ABCD correction (black arrows) at 1.2085 and channel support, also surfacing just beneath 1.21, extended from the low 1.2266 (green).
1.21 will likely be on the watchlist for many this morning (Monday), having noted local confluence by way of an ABCD bullish correction and channel support. A response off 1.21 may tempt a run back to 1.22.
As you can see, price rallied strongly from 1.21 Monday and touched gloves with 1.22 and H4 resistance at 1.2205. Traders may also find use in noting 1.22 converges with weekly resistance at 1.2200. However, a break through this base could lead to H4 price testing channel resistance, extended from the high 1.2642, and maybe, with a little oomph, daily price may take a run towards the underside of the recently broken daily range lows at around 1.2279.
Areas of consideration:
1.22, given its convergence with H4 resistance at 1.2205 and weekly resistance at 1.2200, could hamper further gains, perhaps providing a stage to work with concerning shorts today, targeting 1.21. Conservative traders, despite the confluence sitting around 1.22, may still seek additional candlestick confirmation before engaging.
AUD/USD:
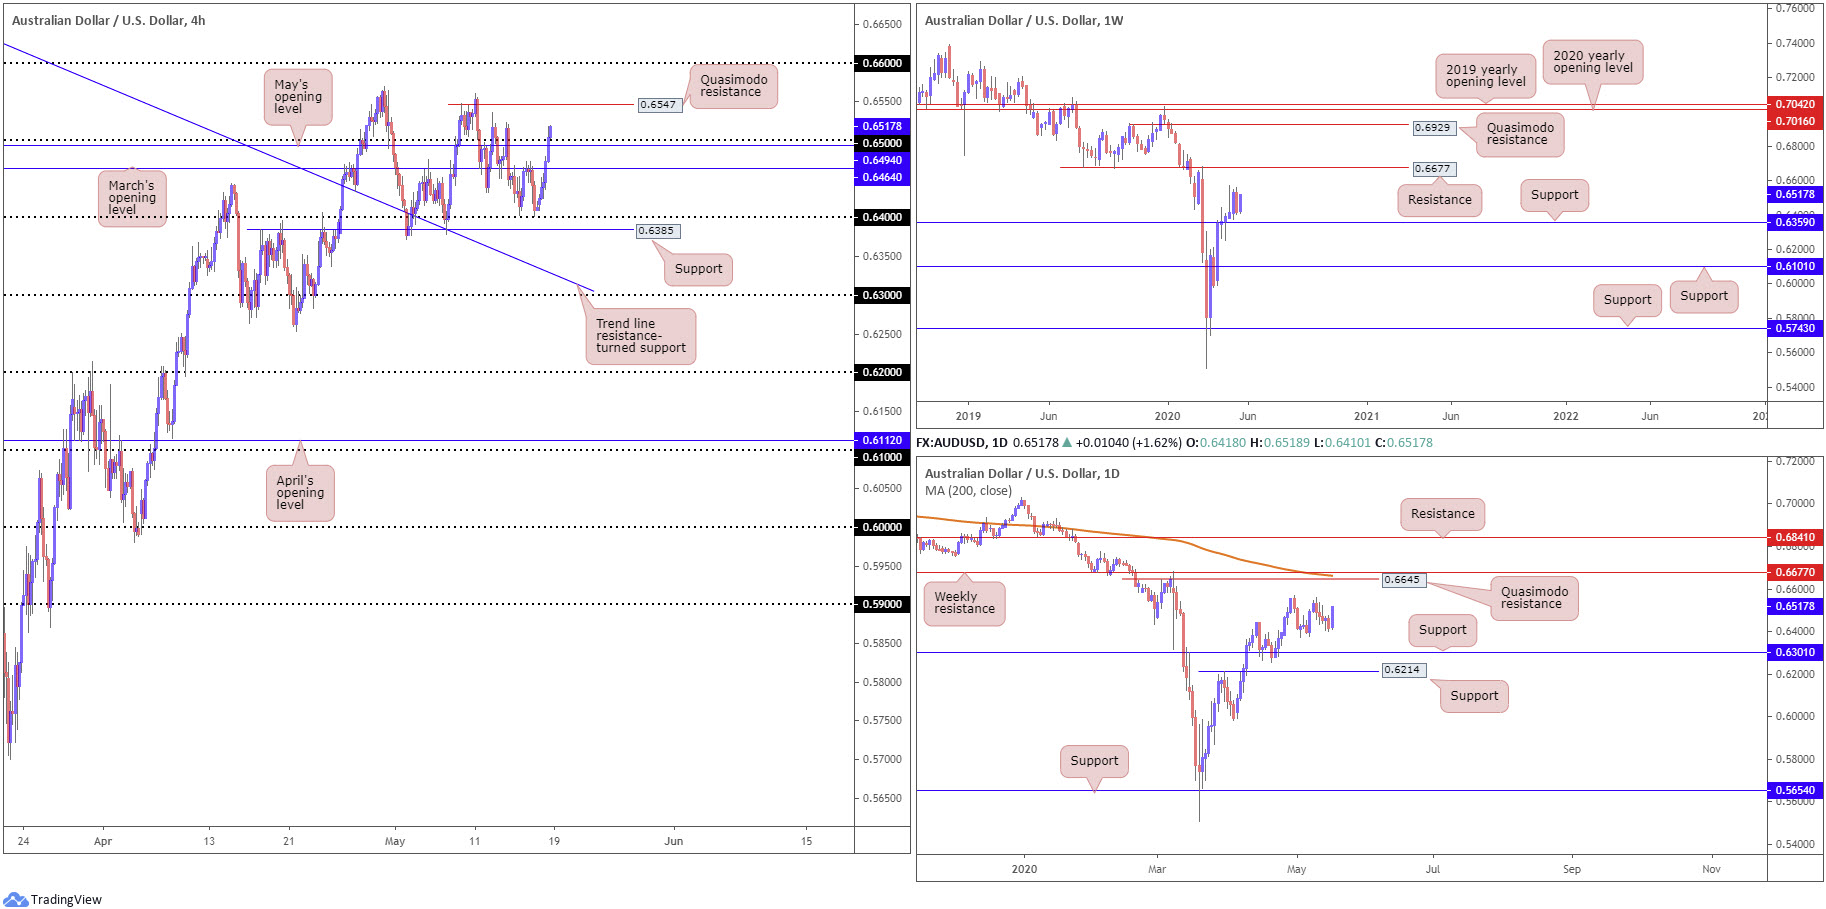
Leaving the 0.64 handle unchallenged, the Australian dollar firmed against the greenback Monday, adding 1.5%. A combination of underlying factors lifted AUD/USD, including upbeat risk sentiment, waning USD and deteriorating US/China relations.
Yesterday’s run higher took over March’s opening level at 0.6464 on the H4 timeframe, May’s opening level at 0.6494 and the round number 0.65, reaching a session peak at 0.6518 and throwing light on Quasimodo resistance at 0.6547. A break of this angle could clear the river north to 0.66, according to our chart studies.
From the higher timeframes, we can see Monday’s rally has recouped a large portion of last week’s downside, a touch ahead of weekly support from 0.6359. With respect to weekly resistance, traders’ crosshairs are likely fixed on 0.6677. Overall, longer-term traders will also note we have been trending lower since the start of 2018.
Technical structure on the daily timeframe has local support sited around 0.6370ish, with the possibility of the April 30 high at 0.6569 serving up resistance. Major resistance can be seen at a Quasimodo formation from 0.6645, parked just ahead of the weekly resistance level mentioned above at 0.6677 and a 200-day SMA (orange – 0.6662). Beneath 0.6370, 0.6301 and 0.6214 are also noted as possible supports.
Areas of consideration:
Bullish strategies above 0.65 are feasible this morning, with scope to approach H4 Quasimodo resistance at 0.6547, followed closely by the April 30 high at 0.6569, and then possibly the 0.66 handle.
Conservative traders will likely be watching for a retest scenario to form off 0.65 before pulling the trigger; other traders may feel a H4 close above 0.65 is enough to justify an upside bias.
USD/JPY:
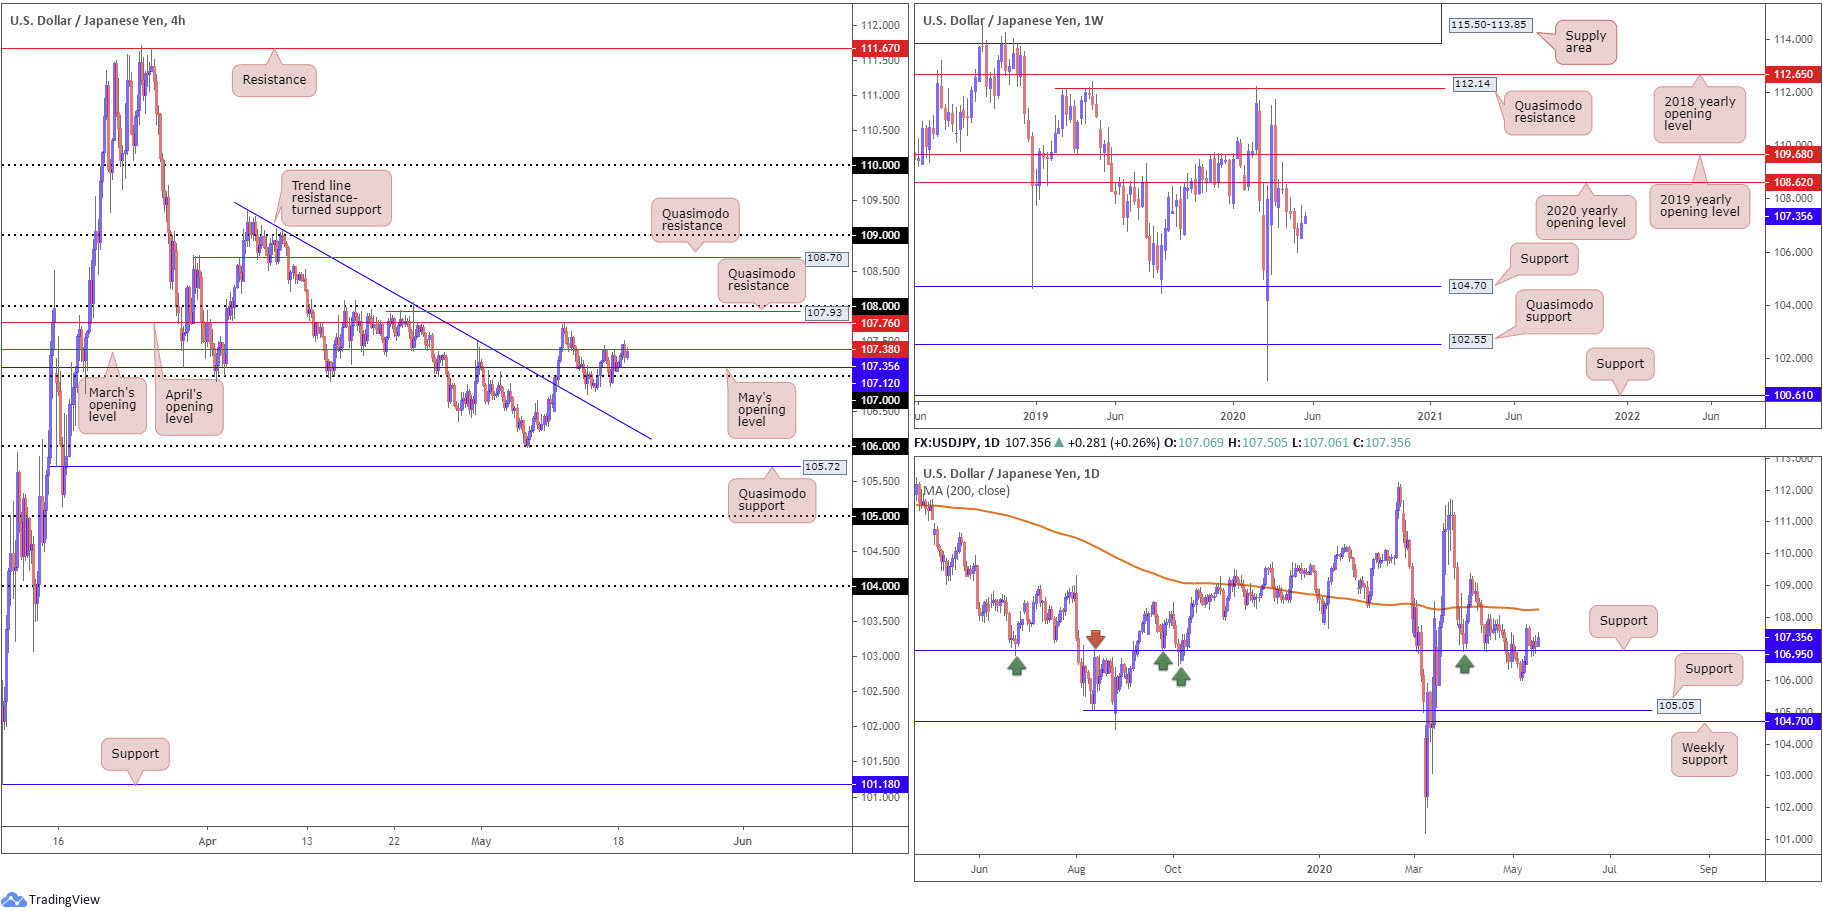
Demand for the safe-haven Japanese yen diminished Monday amid hopes of a global economic recovery. USD/JPY caught a modest bid, though ran into resistance, by way of March’s opening level at 107.38 on the H4 timeframe. Above here, we’re invited to approach April’s opening level at 107.76, Quasimodo resistance at 107.93 and 108. To the downside, nonetheless, we have May’s opening level at 107.12 to contend with, shadowed closely by 107.
Despite last week’s recovery, a move that snapped a five-week bearish phase, and modestly putting up gains Monday, price continues to reflect a bearish tone on the weekly timeframe, south of the 2020 yearly opening level at 108.62, with 104.70 positioned as the next support target.
Technical action on the daily timeframe recently shook hands with support at 106.95, after dipping from three-week tops at 107.76. Current movement throws the 200-day SMA (orange – 108.24) into the firing range as possible resistance.
Areas of consideration:
At this stage, intraday traders possibly have eyes for breakout strategies north of March’s opening level at 107.38, targeting 107.76/108. Above here, the 200-day SMA will be next in line as possible resistance at 108.24.
USD/CAD:
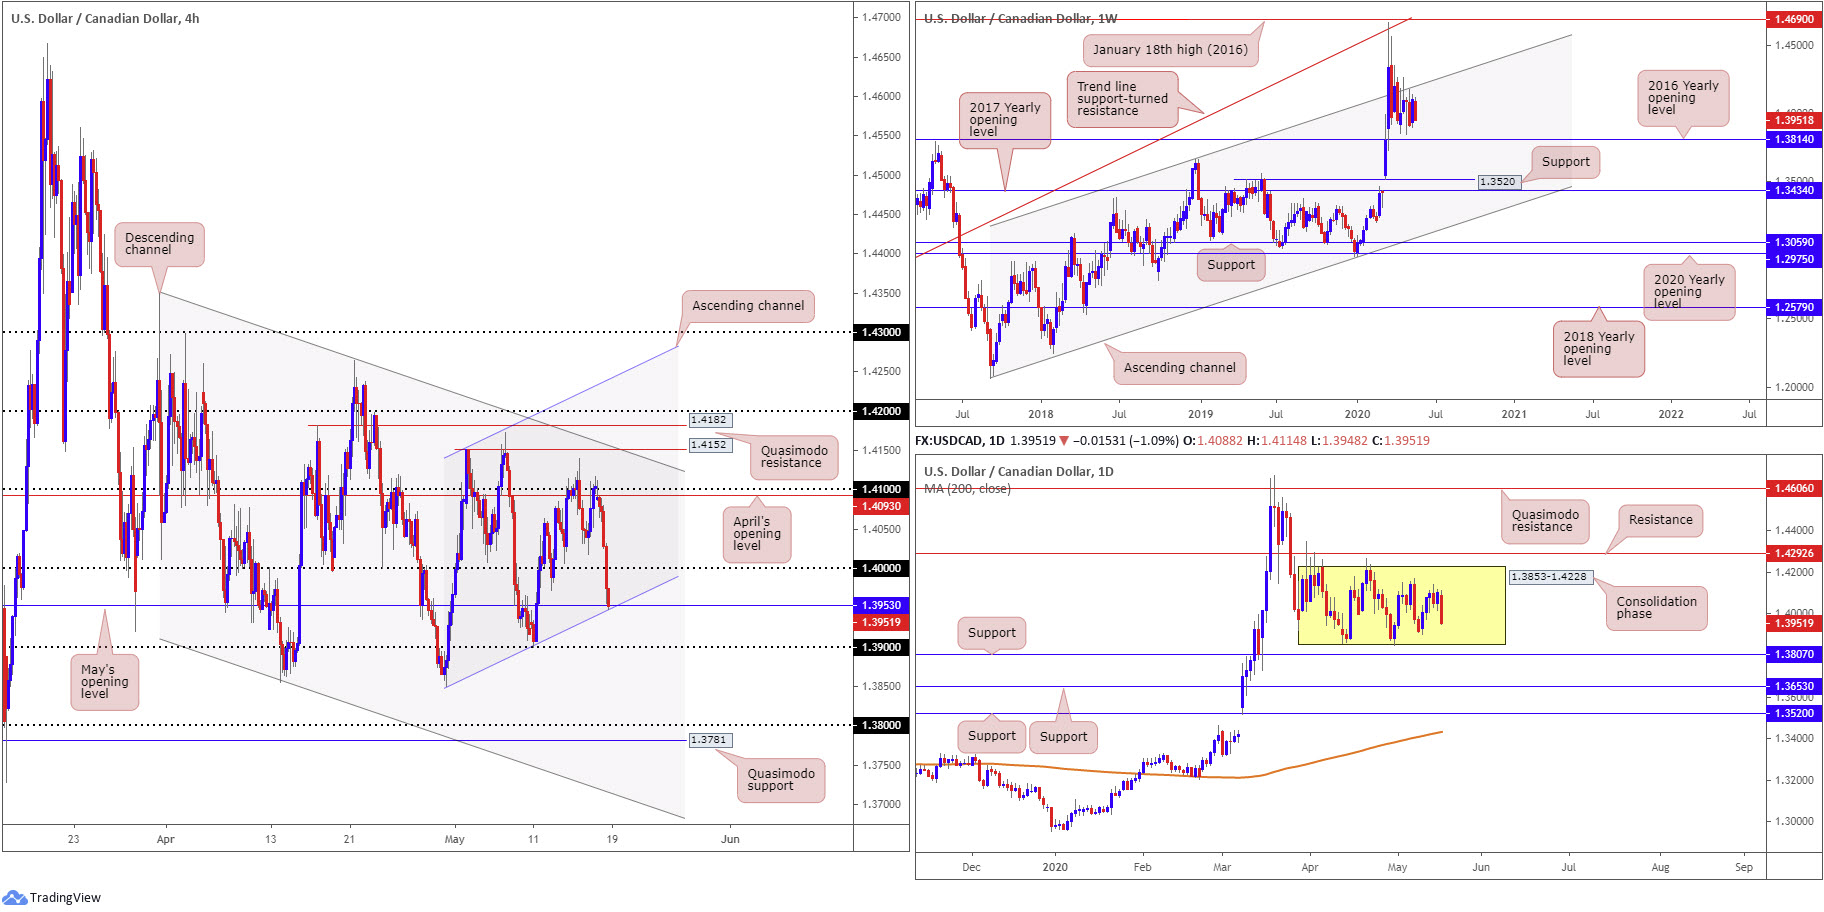
The US dollar shed more than 1.00% against the Canadian dollar Monday, weighed by broad-based USD selling and WTI extending recovery gains to highs of $33.06/bbl.
This took H4 price through the key figure 1.40 and, in recent hours, landed the pair at May’s opening level from 1.3953, coupled with channel support, extended from the low 1.3850. If the said level is taken, 1.39 would likely be the next objective to reach.
Since kicking off April, we have been carving out a consolidation between 1.3853-1.4228 on the daily timeframe. Areas outside of the base can be found at resistance drawn from 1.4292 and support at 1.3807. In addition, the 200-day SMA (orange – 1.3431), as you can probably see, has been drifting northbound since March.
The daily range is also visible on the weekly timeframe, forming mid-way between a long-standing channel resistance, taken from the high 1.3661, and support off the 2016 yearly opening level at 1.3814. The said base stands in a reasonably healthy position as, overall, we’ve been trending higher since September 2017.
Areas of consideration:
May’s opening level from 1.3953, coupled with channel support, extended from the low 1.3850, is an interesting intraday combination, which may see buyers attempt to climb today. Hitting 1.40 from here would likely be a universal cue to reduce risk to breakeven and potentially bank partial profits, while a break above signals the possibility of continued buying to 1.41ish.
The downside from 1.3953 is, of course, the level comes with limited higher-timeframe convergence, therefore we may see traders hold fire at least until a H4 (or H1) bullish candlestick signal emerges.
The accuracy, completeness and timeliness of the information contained on this site cannot be guaranteed. IC Markets does not warranty, guarantee or make any representations, or assume any liability regarding financial results based on the use of the information in the site.
News, views, opinions, recommendations and other information obtained from sources outside of www.icmarkets.com.au, used in this site are believed to be reliable, but we cannot guarantee their accuracy or completeness. All such information is subject to change at any time without notice. IC Markets assumes no responsibility for the content of any linked site.
The fact that such links may exist does not indicate approval or endorsement of any material contained on any linked site. IC Markets is not liable for any harm caused by the transmission, through accessing the services or information on this site, of a computer virus, or other computer code or programming device that might be used to access, delete, damage, disable, disrupt or otherwise impede in any manner, the operation of the site or of any user’s software, hardware, data or property.