


EUR/USD:
Dreary Eurozone PMIs triggered the EUR/USD’s initial decline amid early European trade Thursday, with downside further exacerbated by the press conference after the ECB interest-rate decision in which rates were left unscathed, as expected.
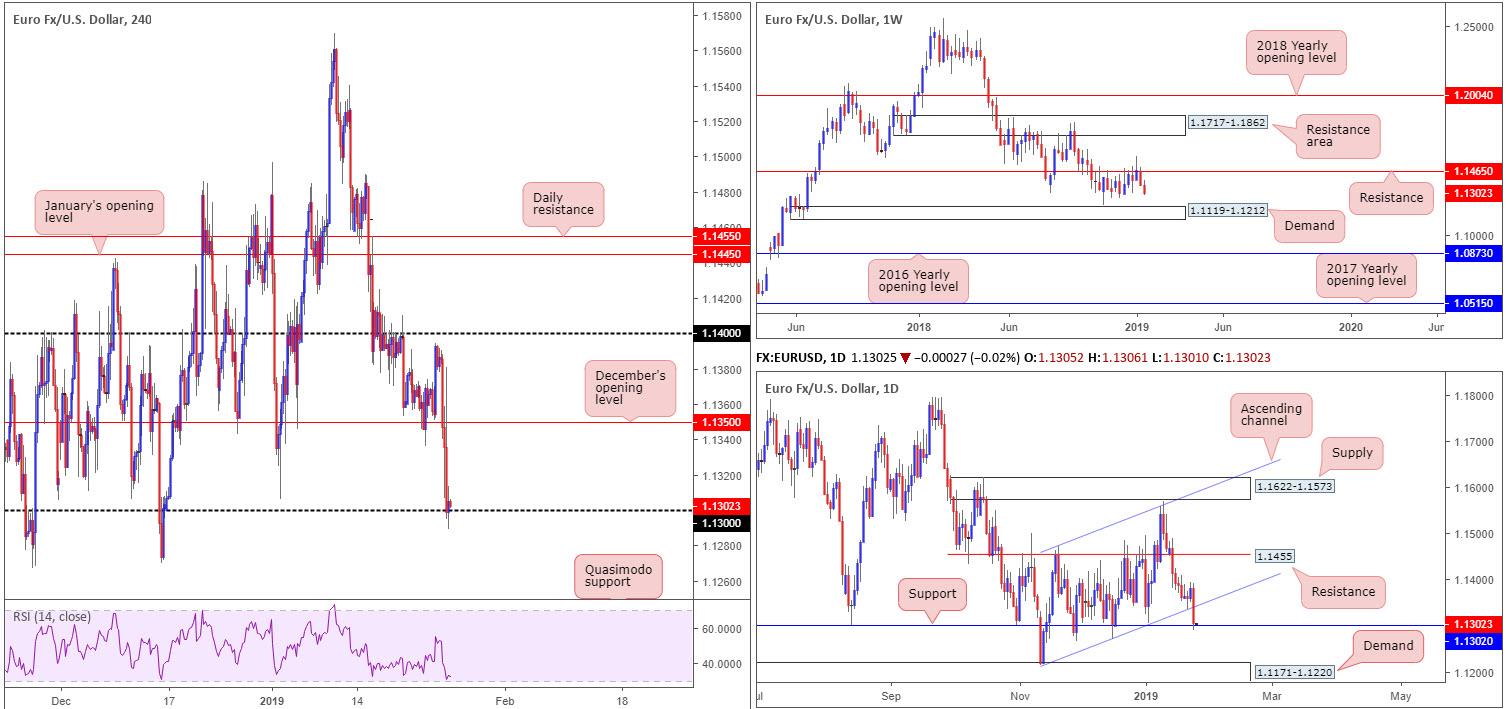
Recent downside, as you can see, easily swept through December’s opening level at 1.1350 on the H4 timeframe, clearing the pathway south towards 1.13, which is holding as support for now. Beyond 1.13 on the H4 scale, the research team sees little in terms of support until we reach 1.1240: a Quasimodo support (not seen on the screen). What’s also notable from a technical perspective is the H4 RSI indicator hovering just ahead of its oversold value.
On a wider perspective, weekly flow is visibly pushing for lower ground, extending losses already felt from resistance at 1.1465. Given the room seen to stretch as far south as demand plotted at 1.1119-1.1212 on this timeframe, further selling could be on the horizon. In terms of the daily scale, however, support at 1.1302 entered the mix yesterday after cleanly engulfing channel support (taken from the low 1.1215), consequently bolstering the round number 1.13 on the H4 timeframe. Note 1.1302 also boasts spectacular history dating as far back as September 2016.
Areas of consideration:
Though yesterday’s run lower emphasizes strength to the downside, a combination of round number interest on the H4 (1.13) and daily support priced in at 1.1302 may be enough to entice buyers into the market, targeting the underside of the aforementioned daily channel support-turned resistance as an initial upside target. Knowing we’re coming from weekly resistance, though, traders are urged to wait for additional H4 candle confirmation to form before pulling the trigger on any longs. Not only will this help identify buyer intent, it’ll also provide entry and stop parameters.
In the event 1.13 fails to hold, shorts will then be on the menu (either as a breakout setup or a breakout/retest play), targeting the H4 Quasimodo support mentioned above at 1.1240, followed by the top edge of daily demand at 1.1220.
Today’s data points: German IFO Business Climate.
GBP/USD:
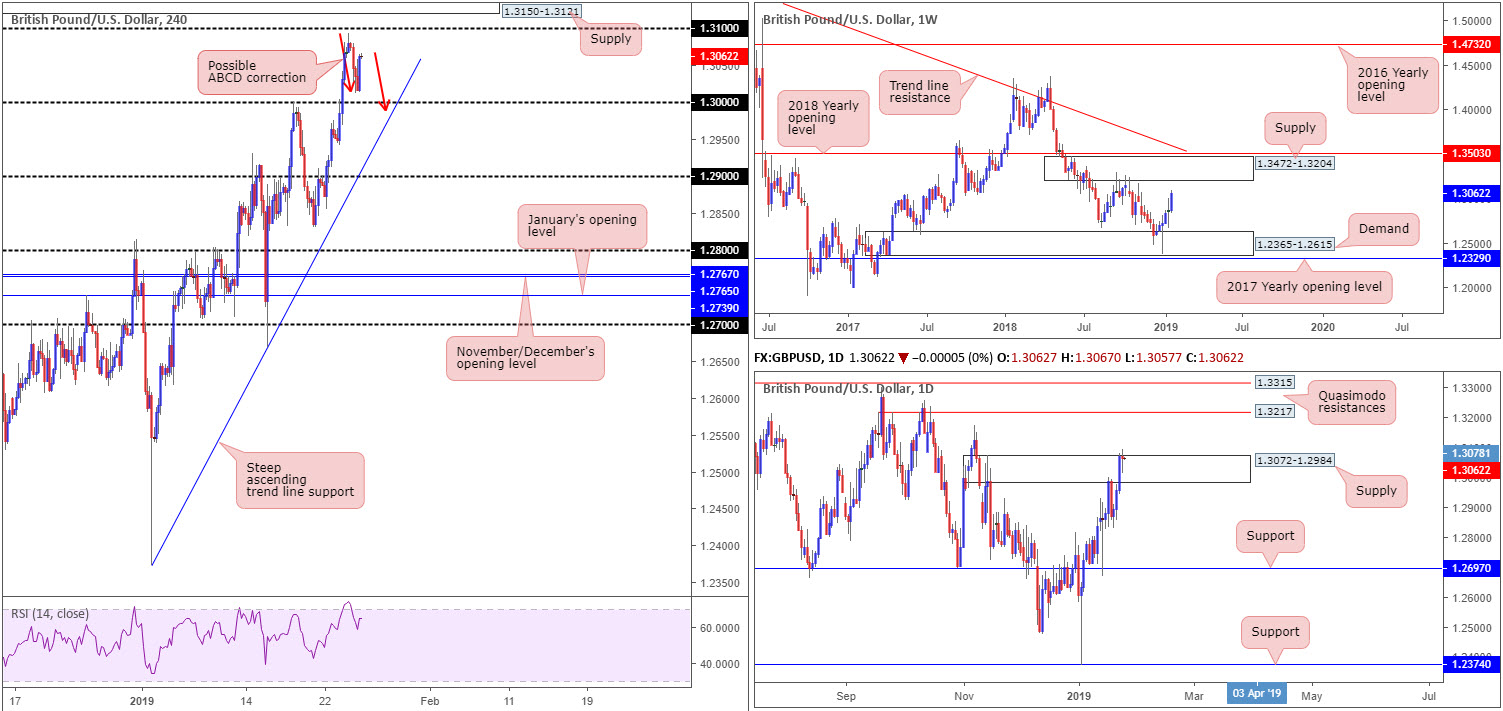
Sterling was largely sidelined Thursday, down a touch at 0.04% at the close of trade. Topping around 1.3094, just south of 1.31, the British pound retreated to lower ground against its US counterpart, though managed to find a floor of support just ahead of 1.30 around 1.3012 into US trading hours on the H4 scale. Aside from 1.31, the next upside target on the H4 resides around supply at 1.3150-1.3121.
Higher up on the curve, buyers and sellers continue to battle for position around the upper edge of daily supply priced in at 1.3072-1.2984. Stop-loss orders, as highlighted in Thursday’s briefing, have likely come under siege. This – coupled with weekly price exhibiting space to explore higher ground towards supply coming in at 1.3472-1.3204 – could lead to further buying materialising in this market.
Areas of consideration:
With all three timeframes offering nods to further upside, a retest of 1.30 in the shape of a possible ABCD correction (red arrows) is likely to be of interest to traders looking to buy this market. Do, however, bear in mind the H4 candles may surpass 1.30 support to bring in additional buyers from the nearby H4 trend line support (taken from the low 1.2373). In similar fashion to the approach proposed on the EUR/USD above, traders are urged to wait for additional H4 candle confirmation to form before pulling the trigger on any longs as this will help avoid an unnecessary loss on a deep fakeout below 1.30. Not only will this help identify buyer intent, it’ll also provide entry and stop parameters to work with.
Today’s data points: Limited.
AUD/USD:
The commodity-driven AUD/USD was heavily knocked from the release of the Australian jobs data Thursday. Initial response witnessed support emerge amid above-forecast employment change and a below-forecast unemployment rate, though the pair swiftly pared back initial gains as markets digested the full release in which growth in employment was largely fuelled by part-time jobs which coincided with the decline in participation rates.
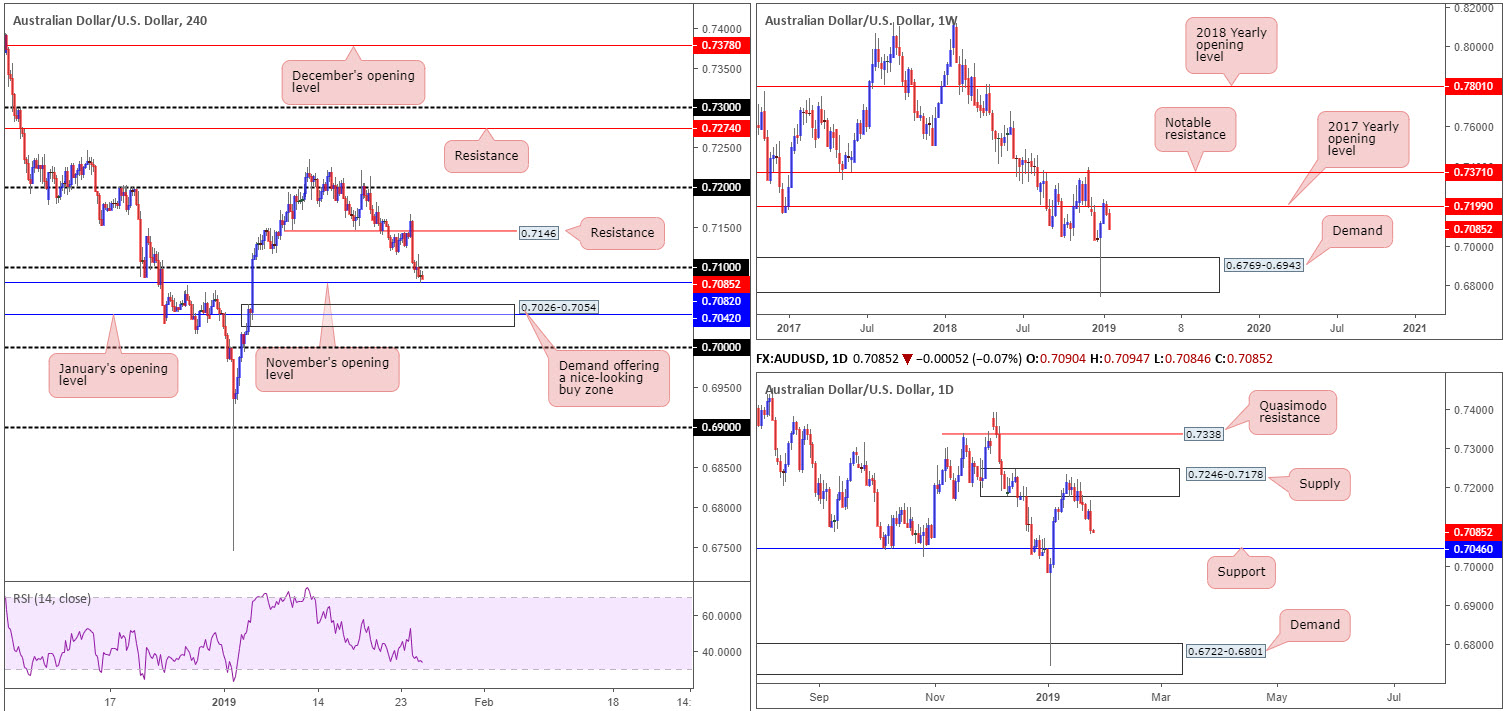
Yesterday’s move lower, printed by way of a daily bearish engulfing candle, eventually eclipsed 0.71 to the downside on the H4 scale. Going into the closing stages of the day, however, support emerged off 0.7082: November’s opening level.
The landscape on the bigger picture continues to reflect a bearish stance. The recently emerged daily bearish engulfing candle, coupled with weekly price extending losses sub resistance at 0.7199 and daily movement exhibiting scope to press as far south as support priced in at 0.7046, is likely to weigh on AUD/USD bulls today we feel.
Areas of consideration:
Although higher-timeframe structure, at current price, offers a somewhat sour tone at the minute, selling this market on the H4 scale is restricted in terms of structure, according to our technical reading.
This has led us back to possible buying opportunities around January’s opening level at 0.7042 on the H4 scale. This number, as you can probably see, merges nicely with support mentioned above at 0.7046 on the daily timeframe, therefore providing a relatively stable platform to consider longs from should we reach this low. What’s also nice about this region is the merging H4 demand area seen at 0.7026-0.7054, offering traders limits to base an entry and stop, targeting 0.71/0.7082 as an initial upside target on the H4.
Although buying the current H4 demand places traders against potential weekly selling, the confluence surrounding 0.7046 is likely sufficient enough to draw in buyer interest.
Today’s data points: Limited.
USD/JPY:
Outlook remains unchanged due to lackluster movement.
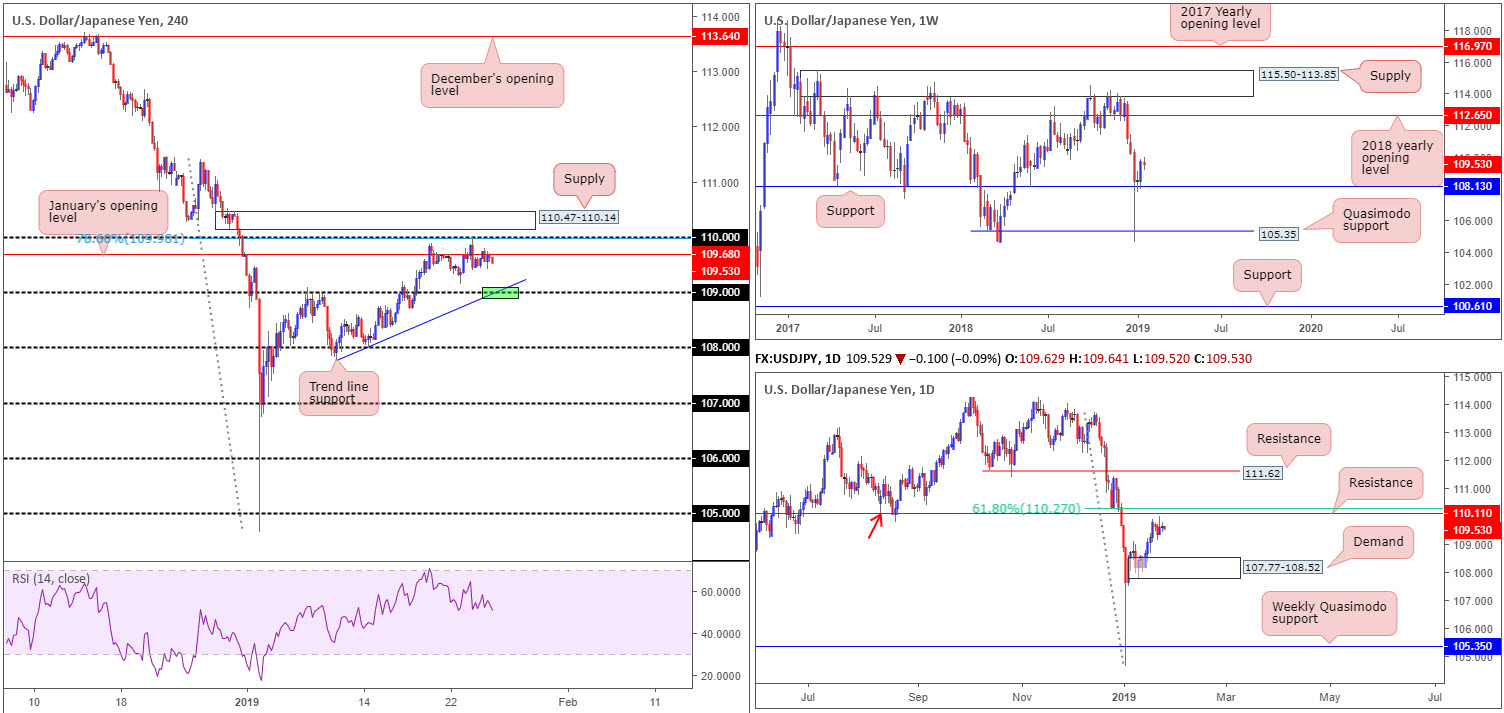
Ranging no more than 40 pips on the day, USD/JPY movement offered an indecisive tone Thursday as the H4 candles crept along the underside of January’s opening level at 109.68. Directly above this number, the 110 handle is visible which happens to align closely with a 78.6% H4 Fibonacci resistance value at 109.98. This is closely followed by a fresh H4 supply zone priced in at 110.47-110.14. To the downside, traders may also want to pencil in 109 as viable support, seeing as it fuses closely with a local trend line support (green – extended from the low 107.77).
On a wider perspective, the weekly timeframe visibly emphasises a bullish tone. Buyers recently found a floor off support priced in at 108.13, with potential, according to overhead structure, of further buying being seen as far north as the 2018 yearly opening level at 112.65. Contrary to weekly levels, daily price action is seen consolidating gains ahead of resistance coming in at 110.10 that’s trailed closely by a 61.8% Fibonacci resistance value at 110.27. 110.10 is essentially a Quasimodo support-turned resistance (red arrow).
Areas of consideration:
The 109 handle, in light of it aligning with trend line support, is worthy of attention for a bounce today, though the research team urges traders to consider waiting for additional candle confirmation (entry/stop levels can be defined according to the selected pattern) to form before pulling the trigger due to the threat of a fakeout (common viewing at round numbers).
Apart from the 109 handle, eyes still also remain on the H4 supply positioned at 110.47-110.14. A push above 110 will not only trip stop-loss orders from traders attempting to fade 110, which, when filled, will become buy orders to sell in to, breakout buyers will also likely attempt to join the movement. This offer of liquidity to sell to, coupled with daily resistance seen plotted at 110.10, is likely enough to draw in attention and bring price action lower.
Traders who feel the need to trade the noted H4 supply based on candle confirmation, waiting for a bearish formation to materialise will certainly add weight to a possible rotation lower. Traders who believe the H4 supply and daily resistance is enough evidence to draw sellers’ attention will likely enter short at 110.14 with stop-loss orders planted just north of 110.47. Once, or indeed if, the H4 candles reclaim 109.68 to the downside out of 110.47-110.14, traders can then think about reducing risk to breakeven and taking partial profits off the table.
Today’s data points: Limited.
USD/CAD:
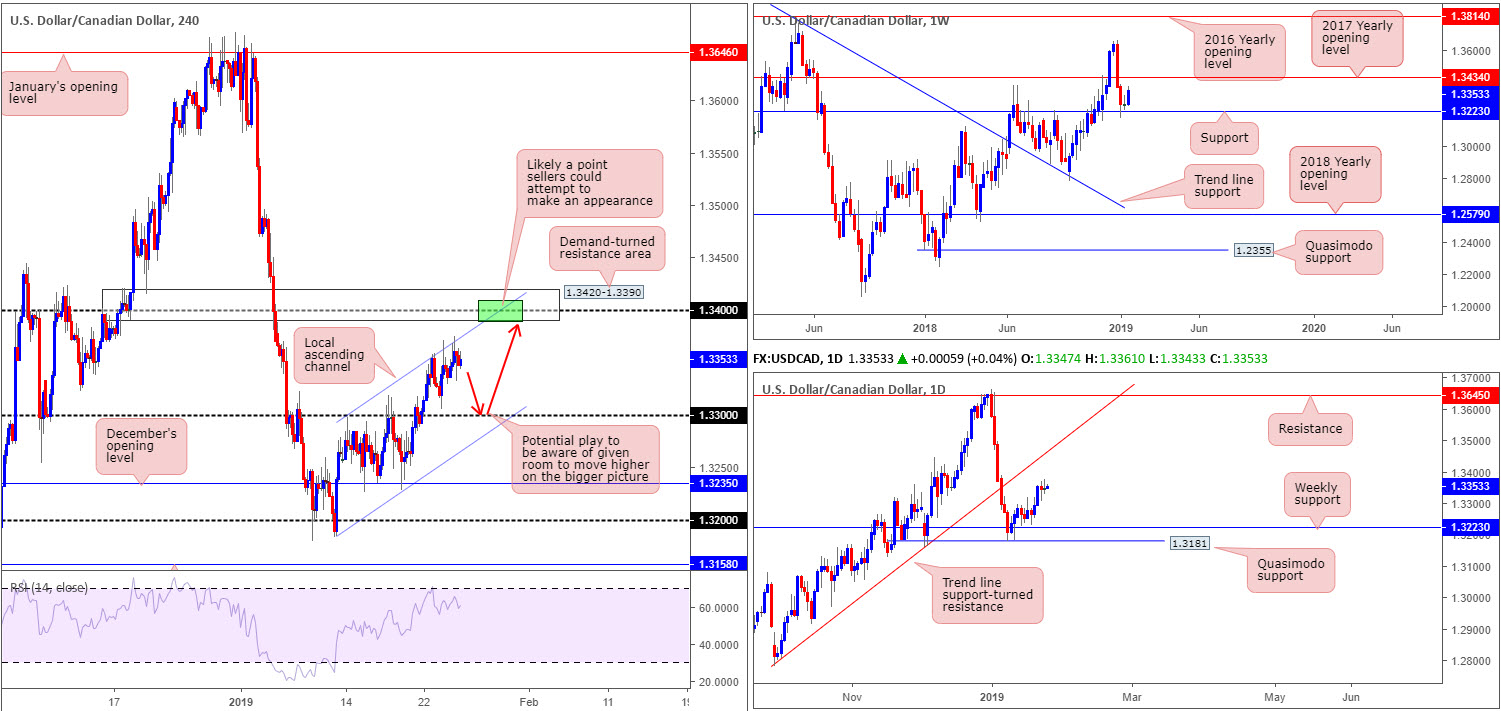
In similar fashion to the USD/JPY, the USD/CAD also featured a somewhat hesitant tone Thursday. Though rising to session highs of 1.3375, its highest point in more than two weeks trade, buyers struggled to preserve an upside presence, consequently returning to pre-opening levels for the day into the closing bell.
As far as technical structure stands, traders likely acknowledge the channel resistance (extended from the high 1.3297) capping upside in this market at the moment on the H4 timeframe. What’s also notable from a technical standpoint is a H4 demand-turned resistance area at 1.3420-1.3390, which happens to clench within it a round number at 1.34 and a 161.8% H4 Fibonacci extension point at 1.3403. The key observation in terms of support on the H4 scale, however, falls in around the 1.33 handle.
In light of the recent lackluster trade, higher-timeframe structure remains unchanged, according to our technical drawings. After weekly price rebounded off support at 1.3223, the current candle appears poised to cross swords with the 2017 yearly opening level at 1.3434. Closer analysis on the daily timeframe reveals the unit shook hands with a daily Quasimodo support at 1.3181 in recent trade. This level, as you can see, is situated just south of the current weekly support level. As long as the buyers continue to defend the said supports, the next port of call to the upside from here falls in around trend line support-turned resistance (extended from the low 1.2782), though it appears weekly resistance is likely to enter the fray beforehand.
Areas of consideration:
On account of the above, the research team notes two possible trading scenarios:
- As both weekly and daily structure suggest buyers govern movement at the moment, a retest off 1.33 is likely of interest to many traders (red arrows). The idea is for H4 sellers to enter the fold off its channel resistance (highlighted above) and tackle 1.33. Concerning upside targets from this number, traders will likely be looking at the H4 channel resistance as a potential trouble area, followed then by the H4 demand-turned resistance zone highlighted above at 1.3420-1.3390. As mentioned in previous reports, stop runs through round numbers are common viewing, therefore, waiting for additional bullish candlestick confirmation to form (entry/stop parameters can be defined according to this pattern) off 1.33 is highly recommended before pressing the buy button.
- The H4 demand-turned resistance zone at 1.3420-1.3390 is a valid sell zone, particularly at the green area where the current channel resistance merges with the round number 1.34. Though do keep in mind, this is only likely good for a bounce given higher-timeframe structure suggests further buying is possibly in store.
Today’s data points: Limited.
USD/CHF:
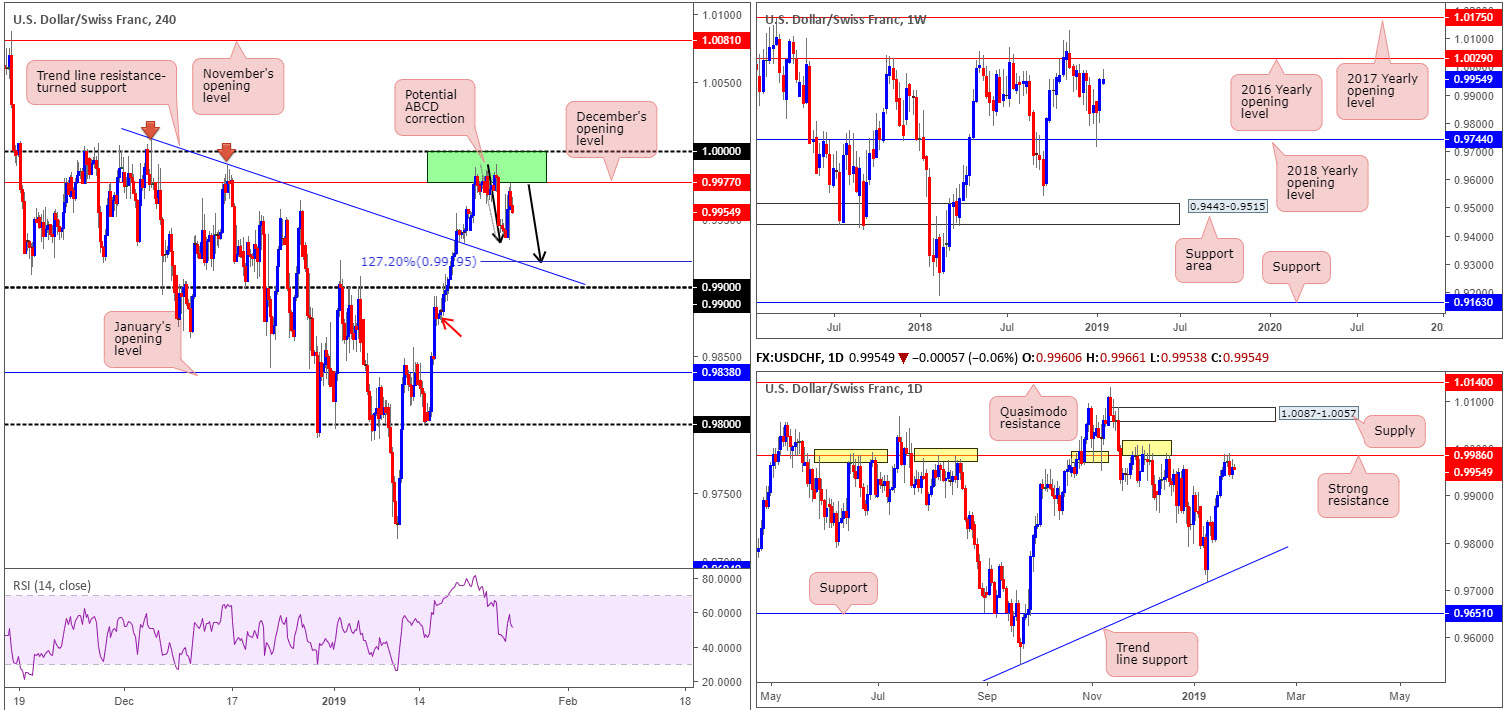
Broad-based USD buying (US dollar index overthrew its 96.50 mark to the upside) bolstered the USD/CHF into US trade Thursday. This, as you can see from the H4 timeframe, hauled the candles back to the lower boundary of 1.0000/0.9977 (comprised of the 1.0000 (parity) level and December’s opening level at 0.9977), which is, once again, holding ground. It is also important to note this area houses daily resistance at 0.9986 within, which by and of itself holds significant history.
Should further selling take shape on the H4 scale, the unit may complete an ABCD 127.2% correction (black arrows) around 0.9919, sited just north of a H4 trend line resistance-turned support. Note this pattern is also strengthened by a nearby round number at 0.99.
With respect to the weekly timeframe, however, the current candle is trading in the shape of a bearish pin-bar formation, though still displays range to extend gains towards the 2016 yearly opening level at 1.0029.
Areas of consideration:
While the research team expects further downside to be seen today, according to our technical observations on the daily timeframe, a bounce from the aforementioned H4 trend line resistance-turned support/nearby 0.99 handle (especially if the H4 candles retreat in the form of an ABCD pattern as highlighted above) is a possibility. To trade long from these levels, though, knowing daily sellers are forcing the unit lower from resistance at 0.9986 is, as you can imagine, a touch precarious. Waiting for additional confirmation, therefore, is recommended before searching for that buy button.
For folks searching for lower levels, a close below 0.99 that’s followed up with a retest as resistance is certainly something to keep a watchful eye out for, targeting January’s opening level at 0.9838. There is a minor H4 demand present around 0.9883ish (red arrow), though given the daily picture we feel this will likely be consumed. For conservative traders wishing to add a little more confirmation to the mix, consider waiting for a bearish candlestick signal to form (preferably off the underside of 0.99 on the retest – entry/stop parameters can be defined according to this pattern) before pulling the trigger.
Today’s data points: Limited.
Dow Jones Industrial Average:
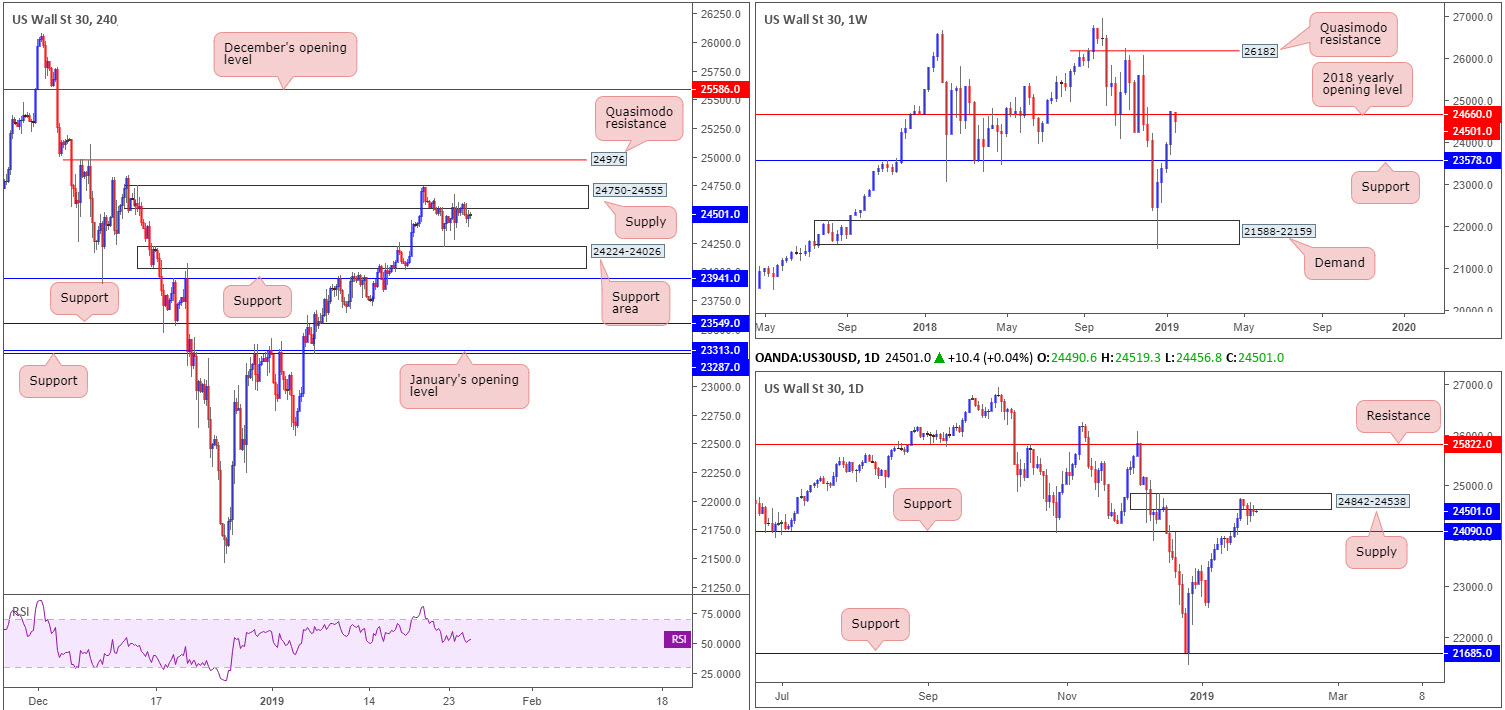
Wall Street traded on a mixed note Thursday, concluding the day mildly in negative territory at 0.21%. This, from a visual standpoint on the charts, places the H4 candles around the underside of supply coming in at 24750-24555.
As highlighted in Thursday’s briefing, H4 structure remains capped between the aforementioned supply and a support area coming in at 24224-24026. Outside of these borders, we have Quasimodo resistance priced in at 24976 and support at 23941. In terms of trend direction on the H4 scale, a fresh higher high is still expected to take shape.
Expanding the view, the research team notes resistance on the weekly timeframe at 24660: the 2018 yearly opening level (sited within the walls of the current H4 supply). This weekly resistance is further validated on the daily timeframe in the shape of a supply zone seen at 24842-24538. The nearest support level on the higher timeframes is daily support found at 24090. A break above here, however, has resistance fixed at 25822 in view.
Areas of consideration:
According to higher-timeframe structure, shorting the index still appears the way forward at the moment. Selling the current H4 supply, however, is still not really considered a high-probability move, largely due to the area already having been tested a number of times already. Therefore, the Quasimodo resistance at 24976 is an area fresh sellers may be vested in.
Traders either have the option of entering short at 24976 and positioning stops above the Quasimodo head (25111), or waiting for a bearish candlestick formation to take shape before pulling the trigger (entry/stop parameters can be defined according to this pattern). Ultimately, the first downside take-profit target appears best set at the H4 support area mentioned above at 24224-24026, though traders should also plan for the possibility of active buying possibly entering the fight around 24750-24555, given this will be considered a support area after its taken out as supply.
Today’s data points: Limited.
XAU/USD (Gold):
Outlook remains unchanged due to lackluster movement.
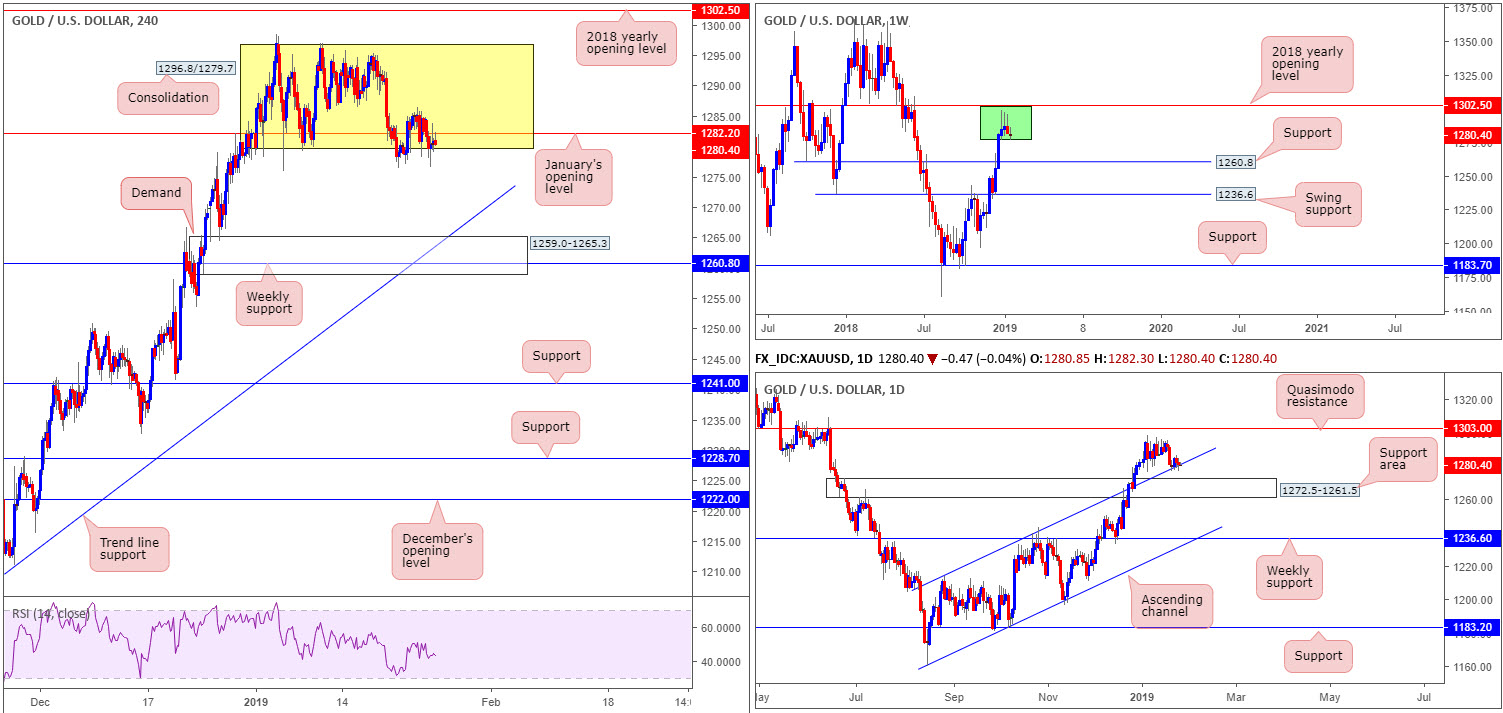
As the US dollar explored higher ground Thursday, with the US dollar index seen overtaking its 96.50 mark, this weighed on the precious metal’s movement consequently recording its second consecutive daily loss.
As is evident from the H4 timeframe, traders can visibly see the candles struggling to find any concrete direction around the lower edge of its range (yellow) between 1296.8/1279.7. Note January’s opening level priced in at 1282.2 is also seen inhabiting the lower limits of the said H4 range.
In light of yesterday’s lackluster performance, much of the following report will echo thoughts put forward in yesterday’s briefing.
From the weekly timeframe, we can see three consecutive bearish pin-bar formations (green) formed just south of the 2018 yearly opening level at 1302.5. Further selling, according to this timeframe, is possible as far south as support coming in at 1260.8. Lower down on the curve, however, we can see daily price crossing swords with channel resistance-turned support (taken from the high 1214.3), which is seen nearby a support area at 1272.5-1261.5. So far, as you can see, this barrier is holding firm.
Areas of consideration:
With H4 price appearing poised to strike lower levels, an area we continue to show love for (though may not enter the fight this week) is the H4 demand zone at 1259.0-1265.3 in view of its connecting confluence: fuses nicely with weekly support at 1260.8 and a H4 trend line support (extended from the low 1196.0). Note this H4 demand is also sited within the lower limits of the daily support area mentioned above at 1272.5-1261.5.
Traders either have the option of entering long on a limit order around 1265.3ish and positioning stop-loss orders below the demand, or wait for additional candlestick confirmation to form and enter long based on this structure. The latter remains the more conservative route.
The use of the site is agreement that the site is for informational and educational purposes only and does not constitute advice in any form in the furtherance of any trade or trading decisions.
The accuracy, completeness and timeliness of the information contained on this site cannot be guaranteed. IC Markets does not warranty, guarantee or make any representations, or assume any liability with regard to financial results based on the use of the information in the site.
News, views, opinions, recommendations and other information obtained from sources outside of www.icmarkets.com.au, used in this site are believed to be reliable, but we cannot guarantee their accuracy or completeness. All such information is subject to change at any time without notice. IC Markets assumes no responsibility for the content of any linked site. The fact that such links may exist does not indicate approval or endorsement of any material contained on any linked site.
IC Markets is not liable for any harm caused by the transmission, through accessing the services or information on this site, of a computer virus, or other computer code or programming device that might be used to access, delete, damage, disable, disrupt or otherwise impede in any manner, the operation of the site or of any user’s software, hardware, data or property.